WHITE PAPER
Pharma Applications of THz-Raman Quantitative Analysis
Overview
THz-Raman™ spectroscopy (also called low-frequency Raman) is based on the detection of vibrations in the 0-200 cm-1 range in addition to the chemical fingerprint region from 200-1800 cm-1 collected by conventional Raman. It has recently emerged as a powerful quantitative analysis modality that provides real-time sample information about structure and phase, with all the advantages – ease of use, remote sensing, and direct measurement – typically associated with optical spectroscopy techniques such as NIR or FTIR. This structural and phase information can be particularly important in pharma applications, but it previously required cumbersome sample prep and the use of more complex off-line methods such as powder x-ray diffraction (PXRD). THz-Raman systems now can be used as standalone instruments or integrated with existing conventional Raman instruments to increase their sensitivity in the low wavenumber region. They are available for use with immersion probes, as benchtop instruments for sample vials, as microscope accessories, and integrated in well plate readers for high throughput screening applications. There are numerous applications in the pharmaceutical industry, and this white paper examines some representative applications selected to highlight the breadth of THz-Raman utility for pharma.

- Polymorph Identification
- Cocrystal Formation
- Crystallinity vs. Amorphous Monitoring
- Multiple Hydrates (Pseudo-Polymorphism)
- High-Throughput Screening
Polymorph Identification
Many active pharmaceutical ingredients (APIs) can be crystallized in multiple forms or polymorphs. This is particularly important in poorly soluble drugs, where various polymorphs can have quite different dissolution characteristics in the gastrointestinal tract, impacting their bioavailability and hence efficacy. In the past, the polymorphism of many drugs was detected fortuitously or through manual time-consuming methods. Today, drug crystal engineering via combinatorial chemistry and high-throughput screening, makes it possible to easily and exhaustively identify stable polymorphic and/or hydrate/anhydrous forms. This means that rapid and reliable identification of polymorphs during the development, manufacturing, and quality assurance process is critical in pharmaceutical manufacturing.
Polymorphs have the same molecular composition but only differ in the way the molecules are packed in a crystal lattice. So traditional optical analysis methods struggle to identify different polymorphs. For example, FTIR, NIR, and conventional Raman analysis are all based on measuring spectral peaks due to intramolecular vibrations that indicate molecular composition. Consequently, polymorph analysis applications have often resorted to other methods such as powder x-ray diffraction (PXRD) or solid-state NMR (ss-NMR), requiring prep of captured samples and complex instrumentation. THz-Raman has been shown to be ideal for this application because it measures low-energy vibrations in samples and these vibrational spectral peaks arise mainly from intermolecular vibrations such as phonon modes and lattice vibrations. The THz-Raman spectrum is thus highly sensitive to even subtle differences in crystal forms. Also, since THz-Raman does not require any special sample preparation, it is compatible with Green Chemistry initiatives to reduce solvent use.
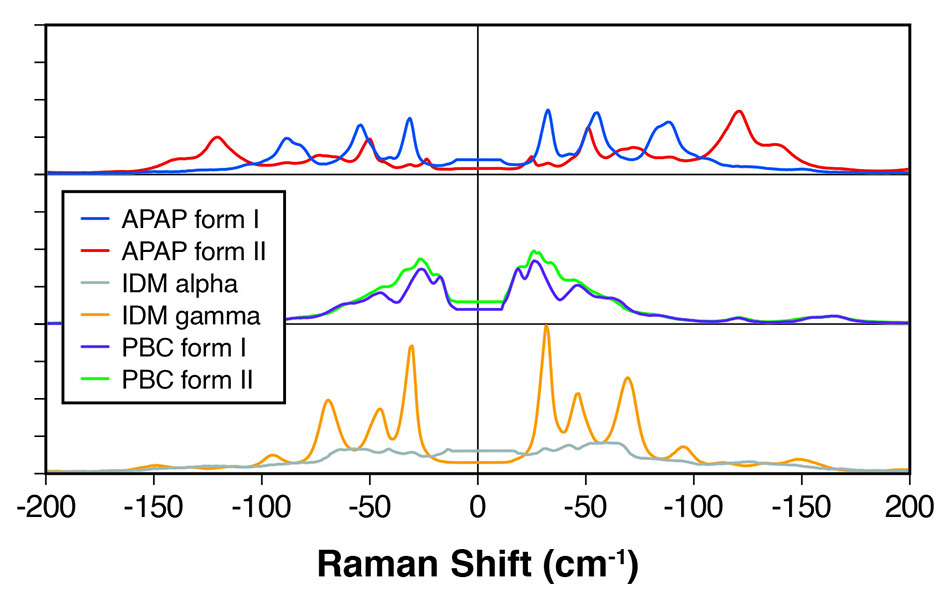
Figure 1: THz-Raman spectra for polymorphs of various APIs showing clearly differentiated peaks.
For example, in a paper in Applied Spectroscopy [1], scientists at Coherent (formerly Ondax) and Bristol-Myers Squibb demonstrated the successful use of THz-Raman analysis to quantitatively differentiate polymorphs and amorphous forms for many common APIs, including carbamazepine (CBZ), caffeine, theophylline, and apixaban. They explained that THz-Raman detects so-called optical phonons, which for aromatic molecular structures have an expected frequency range up to approximately 130 cm-1 (4 THz). They showed that each polymorph has a characteristic THz Raman signature consisting of lattice modes and some low frequency (e.g., torsional) intramolecular vibrations.
In a related study, scientists at Coherent [2] demonstrated the clear spectral differentiation between polymorphs of several other APIs, including indomethacin, probucol, and acetaminophen – see figure 1. They summarized that THz-Raman systems provide fast, unambiguous differentiation of polymorphs, perfectly complementing the higher frequency Raman “chemical fingerprint” region used for chemical identification.
Co-Crystal Formation
Optimizing polymorphs alone is not always sufficient to enable formulation of an API with the requisite thermal stability, dissolution rates and so on. So the pharma industry has developed a range of other approaches to modify these properties. An example is the use of cocrystals to regulate the API’s solubility, stability, and bioavailability. Cocrystals are molecular crystals formed by weak intermolecular interactions such as hydrogen bonding between two different molecular or ionic compounds. They are also of interest in explosives, agrochemicals, and pigments. In pharma, their main use is with low-solubility APIs.
A cocrystal consists of an active pharmaceutical ingredient (APIs) and a so-called coformer. Different cocrystals are often possible with the same API/coformer pairing, based on different stoichiometries. For example, the carbamazepine:4-aminobenzoic acid cocrystal system can exist in 1:1, 2:1, and 4:1 stoichiometric combinations, each with specific dissolution rates and other important physiochemical properties. Cocrystals can be formed by a variety of solid state, slurry, and solution-based methods, and cocrystal preparation remains an active area of research.
Thus, there is a common need from research through QA, screening, and in-process monitoring for a reliable and fast method to quantitatively identify specific cocrystals. Traditional optical methods are focused on spectral peaks based on covalent bonds and can at best show only subtle data differences between cocrystals and mixtures and then between different cocrystals. Powder x-ray diffraction (PXRD) and nuclear magnetic resonance (NMR) spectroscopy can provide the data but need captured and prepared samples and costly instrumentation for off-line measurements. However, since THz-Raman is an optical method that mainly detects intermolecular vibrations and lattice modes it is very well-suited to this analysis challenge as shown by the example in figure 2.
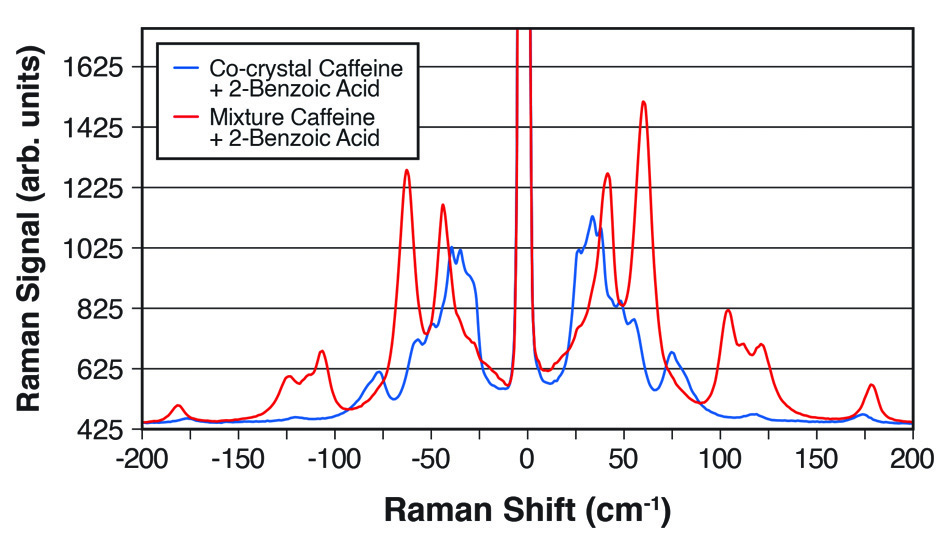
Figure 2: THz-Raman spectra showing the clear differences between a 1:1 cocrystal of caffeine and 2-benzoic acid and a simple mixture of the two chemicals.
In a paper in Industrial & Industrial Chemical Research [3], scientists at Coherent (formerly Ondax), Meiji Pharmaceutical University (Kiyose, Tokyo) and the Japan National Institute of Health Sciences (Setagaya, Tokyo) showed that a THz-Raman spectrometer can quantitatively monitor the formation of cocrystals. Specifically, they studied 1:1 and 2:1 cocrystals of carbamazepine and 4-aminobenzoic acid formed by the reaction crystallization method (RCM) with ethanol as the solvent. THz-Raman data were obtained in real-time using a spectrometer fiber-coupled to an immersion probe, with data fitting based on multivariate curve resolution (MCR). In addition to quantitative sample analysis, they also showed that the technique can be used to follow the transformation between cocrystals with different stoichiometries, and to determine the reaction rate and time to end point, confirming the utility of THz-Raman as a real-time useful process analysis tool for cocrystallization processes.
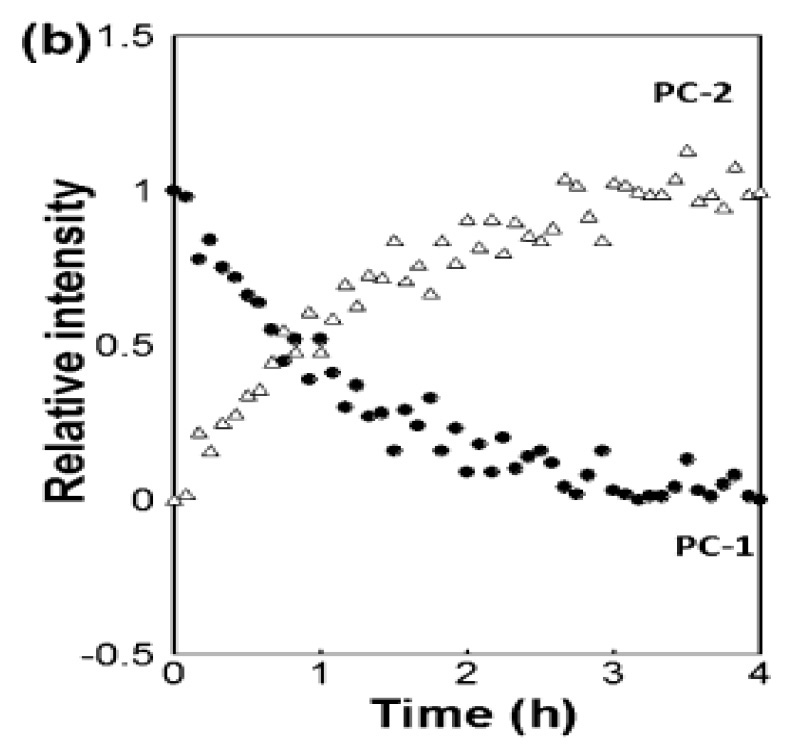
Figure 3: Real-time monitoring of the transformation of 1:1 cocrystals of carbamazepine and 4-aminobenzoic acid into 2:1 cocrystals, based on MCR fitting of the THz-Raman spectral data. Reproduced from [3] with permission.
Crystallinity vs. Amorphous Monitoring
The low frequency Raman spectrum is dominated by sharp peaks due to crystal lattice modes and optical phonons, which means that a THz-Raman analyzer can measure the concentration of a particular crystal in a mixture of phases, i.e., act as a “crystallinity monitor” [4] The gold standard in crystal identification is powder x-ray diffraction (PXRD) which produces data in the form of a pattern of bright spots at specific diffraction angles based on the lattice properties of the material. However, amorphous materials produce a broad halo of diffracted x-rays due to their semi-random, disordered orientation of molecules, which acts as a noise floor and sets the limit of detection (LOD). This means that it is usually not possible to reliably measure crystallinity content with PXRD, when that content falls below about 5%.
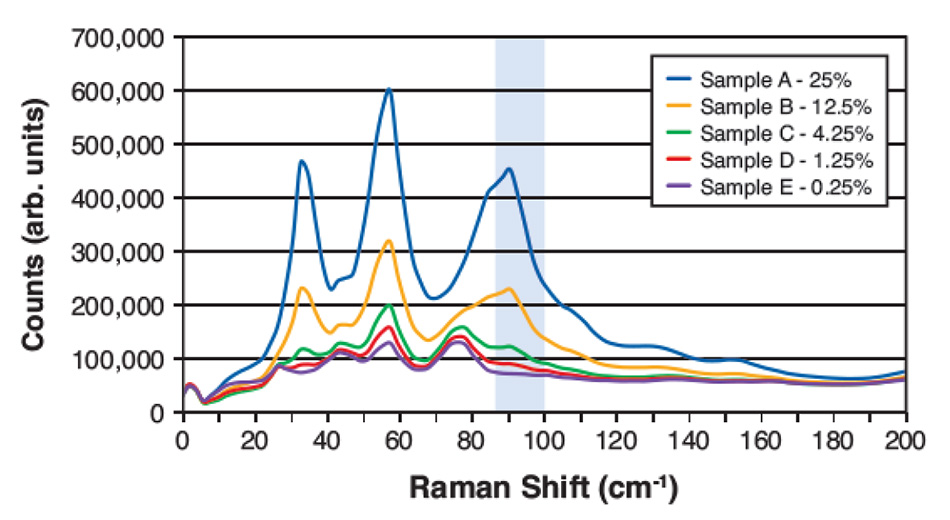
Figure 4: THz-Raman spectra for five different weight-to-weight measured mixtures of Acetaminophen in Mannitol. The highlighted region shows the area with strong Acetaminophen signals and low overlap with Mannitol that was used to calculate content.
However, with THz-Raman spectroscopy, some of the sharp peaks due to crystalline components are still clearly differentiable, even at low concentrations. Here the LOD depends on choosing spectral components due to the target, with minimized overlap with spectral features due to the background materials. Figure 4 shows THz-Raman spectra from a recent study of dilute mixtures of acetaminophen in mannitol. The highlighted frequency region was chosen for fitting, based on the low overlap of the acetaminophen signal with signals due to mannitol. After accounting for density differences between the materials and performing background removal and baseline corrections, a predicted (weight to weight) concentration was calculated based on the magnitude of the residual signal integrated over this spectral window.
Figure 5 shows a plot of calculated vs. actual concentration using this simple calculation for five different concentrations. Based on this plot, the LOD was determined to be ~1%, with the higher errors at low concentrations due to localized spatial variations of the sample mixture and despite some residual overlap between spectral signatures in the analyzed region. This is well below the typical LOD for PXRD and comparable to solid state-NMR (ss-NMR). Different combinations of materials with better mixture uniformity or separation between spectral peaks would have an even lower LOD.
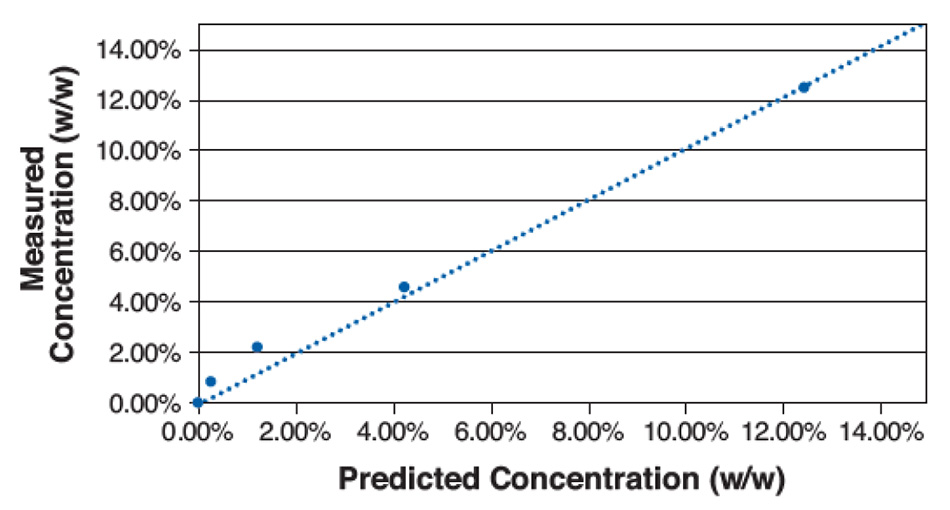
Figure 5: Plot of measured concentration vs. predicted concentration for various mixtures of acetaminophen in mannitol.
Data from other systems in the Coherent THz-Raman spectroscopy applications lab indicate that even simpler analysis may suffice to quantify the degree of crystallinity in some process monitoring cases. Specifically, the crystalline peaks are so universally sharp compared to the broad Boson feature of an amorphous background that it is often possible to approximate the degree of crystallinity simply from analysis of the mean spectral derivative (slope) in the low frequency region.
The ability to determine crystallinity both in the lab and on-line in real time is clearly an advantage with broad applicability across many areas of the pharma and chemical industries.
Multiple Hydrates (Pseudo-Polymorphism)
Pseudopolymorphism refers to crystal phases of the same compound that vary by the amount of solvent material incorporated in the crystal lattice. For example, in the case of aqueous mixtures these take the form of hemi-, mono-, di-, and trihydrate phases, as well as mixtures of these. In another published study [5], scientists at Coherent (formerly Ondax), Meiji Pharmaceutical University (Kiyose, Tokyo) and the Japan National Institute of Health Sciences (Setagaya, Tokyo) demonstrated the ability of THz-Raman spectroscopy to determine the amount of various hydrates in solid samples of magnesium stearate (Mg-St). They noted that previous studies had showed that powder lubrication, densification, and flowability were all different for the monohydrate and dihydrate forms of Mg-St. They also noted that the identification of the magnesium salt, the relative content of stearic acid by gas chromatography, and the water content are collectively not sufficient to uniquely determine the pseudopolymorphism of Mg-St. This uncertainty can be increasingly problematic where global corporations source raw materials from different locations with varying levels of good manufacturing practices.
In this study, 10 samples of Mg-St acquired from different suppliers were analyzed by PXRD as well as thermogravimetry and differential thermal analysis (TGDTA), allowing them to be described by hydrate type(s). Conventional (chemical fingerprint) Raman at high frequencies showed very minor differences between the hydrates. But as shown in figure 6, when each pseudopolymorph of Mg-St was measured using the low-frequency region, there were differences in peaks between 30 and 60 cm−1 and between 100 and 180 cm−1. In particular, a peak in the spectrum of each hydrate was clearly separated in the region between 100 and 180 cm−1, and this enabled discrimination between the monohydrate and the other hydrates even where the Mg-St was a mixture of pseudopolymorphs.
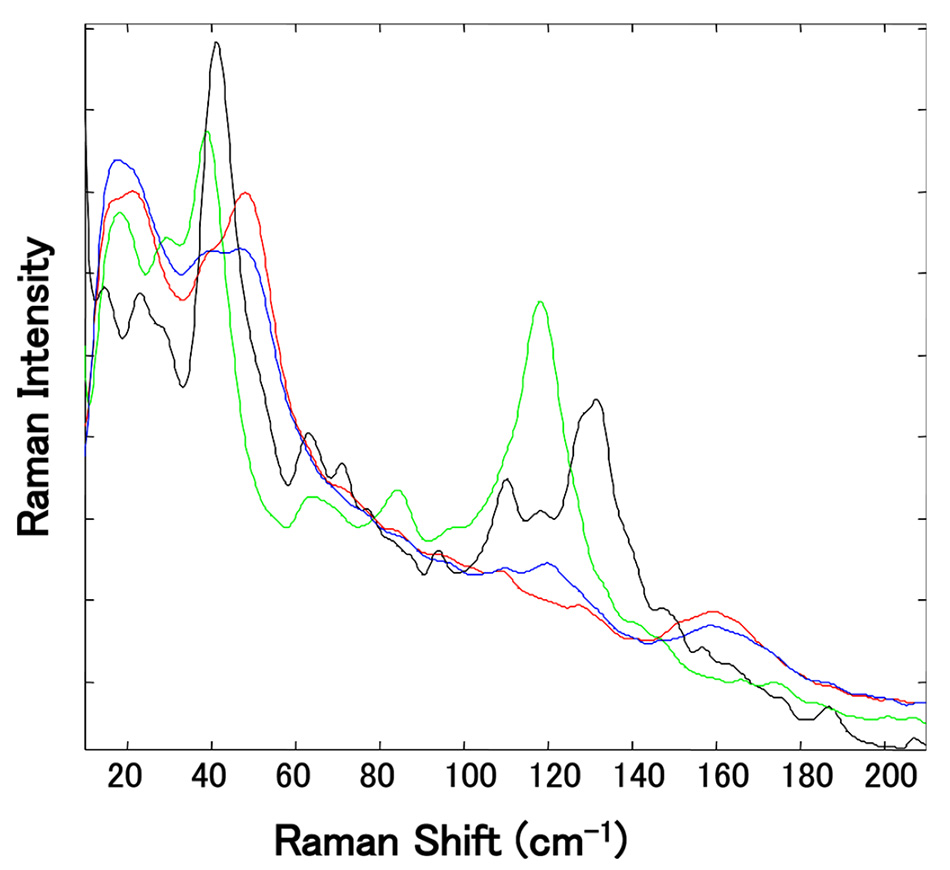
Figure 6: Enlarged view of the normalized THz-Raman spectra of several independently sourced Mg-St samples. (The green peak at 118 cm-1 is due to the presence of trihydrate and the black peak at 129 cm-1 is associated with the dihydrate.) Reproduced from [5] with permission.
High-Throughput Screening
The above applications highlight how THz-Raman spectroscopy is a convenient and simpler alternative to PXRD and ss-NMR for rapidly determining the average phase of a sample. Neither of those somewhat cumbersome older techniques can perform spatial mapping. In contrast, the ability to make Raman and THz-Raman measurements through an objective lens supports both adjustment (zooming) and scanning of the sampling area, uniquely enabling mapping (imaging) of a sample under a microscope for both composition and structure/phase. This imaging capability also enables mapping of well plates and mapping within wells for high throughput screening (HTS) applications, and Coherent offers a fully automated well plate reader – the TR-WPS – to provide turnkey analysis for most common well plate formats from 6 to 1536 wells [6].
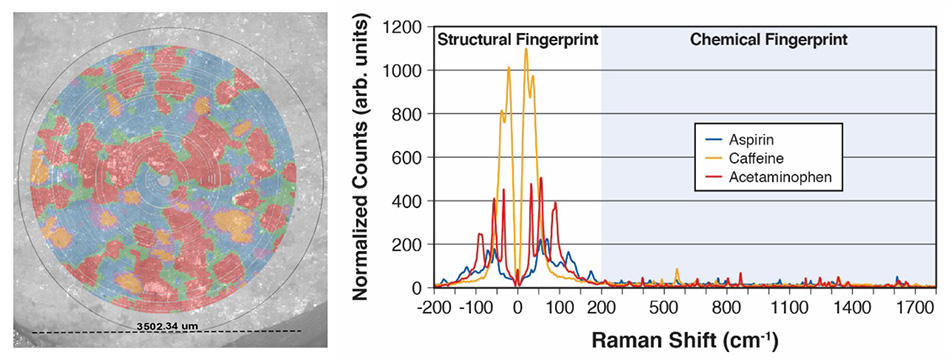
Figure 7: An Excedrin table simultaneously mapped for three APIs and the corresponding THz-Raman spectra used to create this map based on principal component analysis (PCA) and clustering.
Figure 7 shows false-color data from a simple demonstration of the TR-WPS in the Coherent applications lab. Specifically, a single tablet of Excedrin® was placed in a well and >27k spectral data points were collected over a 3.5 mm diameter region of the tablet in 9 mins. Principal component analysis (PCA) and clustering was used to identify the three constituent compounds (Acetaminophen, Aspirin and Caffeine) plus mixtures in the boundary regions. Polarized light microscopy (PLM) images were concurrently taken for the region then overlaid with the Raman map for visual comparison. The corresponding spectra are shown to clearly illustrate the high quality, strong magnitude data, demonstrating the ability of the TR-WPS to quickly identify and discriminate between materials or polymorphs, and to capture both visual and spectral data.
® Excedrin is a registered trademark of GlaxoSmithKline
Summary
THz-Raman spectroscopy enables real-time, non-contact analysis of samples, delivering structural information which would otherwise require sample prep and off-line measurements via unwieldy techniques such as PXRD and ss-NMR. It is particularly useful when seamlessly integrated with conventional Raman enabling samples to be simultaneously interrogated for both composition and structure. This survey of several pharma applications illustrates the breadth of potential uses, with benefits that also directly translate into numerous other industries, including polymer sciences, semiconductor materials, and industrial chemicals.
References
1. P.J. Larkin et al, Polymorph Characterization of Active Pharmaceutical Ingredients (APIs) Using Low-Frequency Raman Spectroscopy, Applied Spectroscopy, Vol 68, Number 7, 2014
2. Coherent, Inc., Polymorph Identification in Pharmaceuticals, Application Highlights, 2019
3. M. Inoue et al, Real-Time Formation Monitoring of Cocrystals with Different Stoichiometries Using Probe-Type Low-Frequency Raman Spectroscopy, Ind. Eng. Chem. Res., Vol, 56, #44, 12693–12697, 2017
4. J. Wallace, Terahertz-Raman Instrument Becomes a Crystallinity Phase Monitor, Laser Focus World, 6, 2020
5. T. Koide et al, Identification of Pseudopolymorphism of Magnesium Stearate by Using Low-Frequency Raman Spectroscopy, Org. Process Res. Dev., Vol 20, 1906−1910, 2016
6. Coherent, Inc., High Throughput Screening Using THz-Raman, Application Highlights, 2020