白皮书

Pharma Applications of THz-Raman Quantitative Analysis

Overview

THz-Raman™ spectroscopy (also called low-frequency Raman) is based on the detection of vibrations in the 0-200 cm-1 range in addition to the chemical fingerprint region from 200-1800 cm-1 collected by conventional Raman. It has recently emerged as a powerful quantitative analysis modality that provides real-time sample information about structure and phase, with all the advantages – ease of use, remote sensing, and direct measurement – typically associated with optical spectroscopy techniques such as NIR or FTIR. This structural and phase information can be particularly important in pharma applications, but it previously required cumbersome sample prep and the use of more complex off-line methods such as powder x-ray diffraction (PXRD). THz-Raman systems now can be used as standalone instruments or integrated with existing conventional Raman instruments to increase their sensitivity in the low wavenumber region. They are available for use with immersion probes, as benchtop instruments for sample vials, as microscope accessories, and integrated in well plate readers for high throughput screening applications. There are numerous applications in the pharmaceutical industry, and this white paper examines some representative applications selected to highlight the breadth of THz-Raman utility for pharma.

Polymorph Identification

Many active pharmaceutical ingredients (APIs) can be crystallized in multiple forms or polymorphs. This is particularly important in poorly soluble drugs, where various polymorphs can have quite different dissolution characteristics in the gastrointestinal tract, impacting their bioavailability and hence efficacy. In the past, the polymorphism of many drugs was detected fortuitously or through manual time-consuming methods. Today, drug crystal engineering via combinatorial chemistry and high-throughput screening, makes it possible to easily and exhaustively identify stable polymorphic and/or hydrate/anhydrous forms. This means that rapid and reliable identification of polymorphs during the development, manufacturing, and quality assurance process is critical in pharmaceutical manufacturing.

Polymorphs have the same molecular composition but only differ in the way the molecules are packed in a crystal lattice. So traditional optical analysis methods struggle to identify different polymorphs. For example, FTIR, NIR, and conventional Raman analysis are all based on measuring spectral peaks due to intramolecular vibrations that indicate molecular composition. Consequently, polymorph analysis applications have often resorted to other methods such as powder x-ray diffraction (PXRD) or solid-state NMR (ss-NMR), requiring prep of captured samples and complex instrumentation. THz-Raman has been shown to be ideal for this application because it measures low-energy vibrations in samples and these vibrational spectral peaks arise mainly from intermolecular vibrations such as phonon modes and lattice vibrations. The THz-Raman spectrum is thus highly sensitive to even subtle differences in crystal forms. Also, since THz-Raman does not require any special sample preparation, it is compatible with Green Chemistry initiatives to reduce solvent use.

thz-raman-pharma-figure-1.jpg

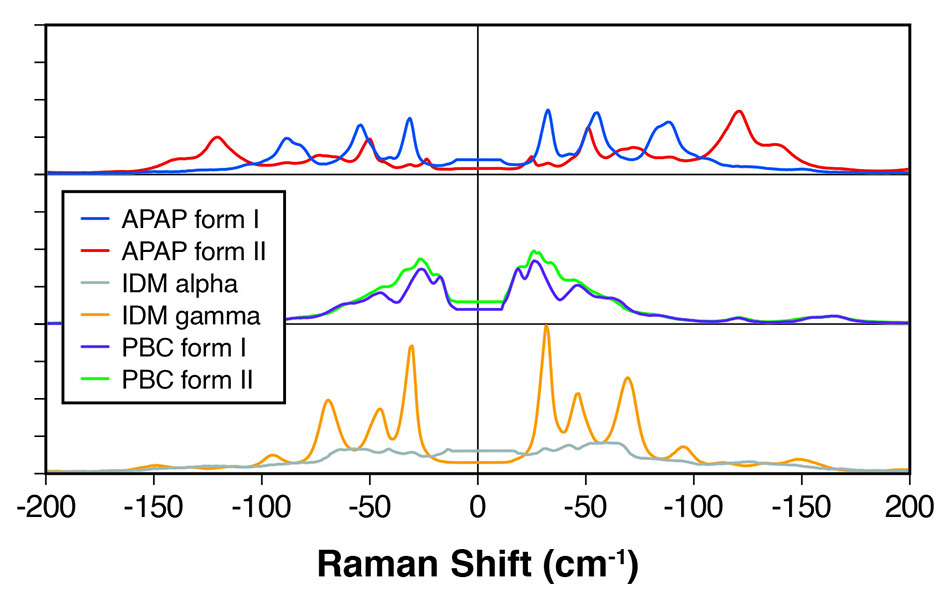
图 1: 用于多种 API 的多晶型物的太赫兹拉曼光谱,显示了明显差异化的光谱峰。

例如,在《Applied Spectroscopy》[1] 的一篇论文中,Coherent(原 Ondax)和 Bristol-Myers Squibb 的科学家证明,太赫兹拉曼分析可成功用于定量区分许多常见 API 的多晶型和非晶态形式,包括卡马西平 (CBZ)、咖啡因、茶碱和阿哌沙班。 他们解释说,太赫兹拉曼光谱对所谓的光学声子进行检测,对于芳香分子结构,其预期频率范围可达约 130 cm-1 (4 THz)。 他们表明,每种多晶型物都具有由晶格模式和某些低频(例如,扭转型)分子内振动组成的特有太赫兹拉曼特征。 

在一项相关研究中,Coherent [2] 的科学家证明了其他若干 API 的多晶型物之间存在明显的光谱差异,此类多晶型物包括吲哚美辛、普罗布考和对乙酰氨基酚,如图 1 所示。他们总结说太赫兹拉曼系统可快速、明确地对多晶型物进行区分,与高频拉曼“化学指纹”区域相辅相成,用于化学鉴定。


Co-Crystal Formation

Optimizing polymorphs alone is not always sufficient to enable formulation of an API with the requisite thermal stability, dissolution rates and so on. So the pharma industry has developed a range of other approaches to modify these properties. An example is the use of cocrystals to regulate the API’s solubility, stability, and bioavailability. Cocrystals are molecular crystals formed by weak intermolecular interactions such as hydrogen bonding between two different molecular or ionic compounds. They are also of interest in explosives, agrochemicals, and pigments. In pharma, their main use is with low-solubility APIs.

A cocrystal consists of an active pharmaceutical ingredient (APIs) and a so-called coformer. Different cocrystals are often possible with the same API/coformer pairing, based on different stoichiometries. For example, the carbamazepine:4-aminobenzoic acid cocrystal system can exist in 1:1, 2:1, and 4:1 stoichiometric combinations, each with specific dissolution rates and other important physiochemical properties. Cocrystals can be formed by a variety of solid state, slurry, and solution-based methods, and cocrystal preparation remains an active area of research.

Thus, there is a common need from research through QA, screening, and in-process monitoring for a reliable and fast method to quantitatively identify specific cocrystals. Traditional optical methods are focused on spectral peaks based on covalent bonds and can at best show only subtle data differences between cocrystals and mixtures and then between different cocrystals. Powder x-ray diffraction (PXRD) and nuclear magnetic resonance (NMR) spectroscopy can provide the data but need captured and prepared samples and costly instrumentation for off-line measurements. However, since THz-Raman is an optical method that mainly detects intermolecular vibrations and lattice modes it is very well-suited to this analysis challenge as shown by the example in figure 2.

thz-raman-pharma-figure-2.jpg

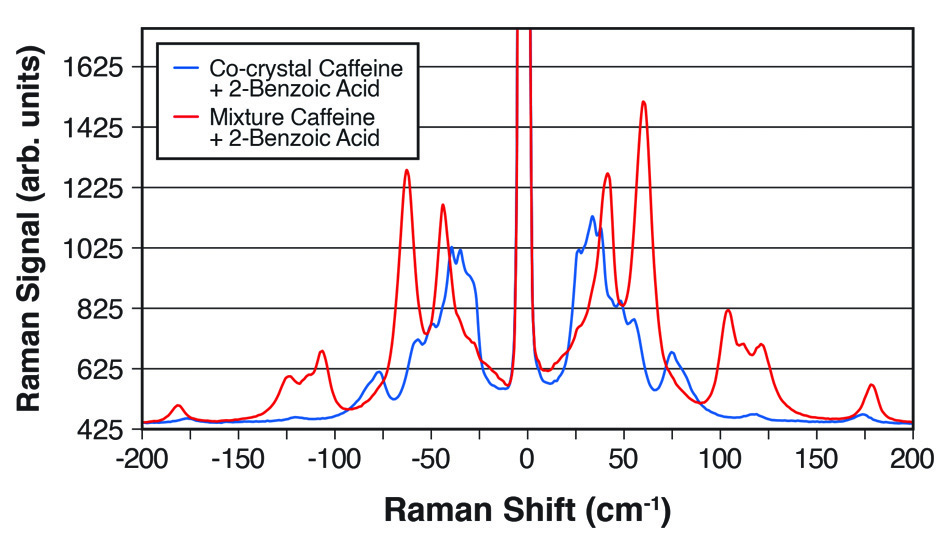
图 2: 太赫兹拉曼光谱显示了咖啡因和 2-苯甲酸的 1:1 共晶体与两种化学物质的简单混合物之间的明显差异。

在《Industrial & Industrial Chemical Research》的一篇论文中 [3],Coherent(原 Ondax)、明治药科大学(东京清濑)和日本国立卫生科学研究所(东京世田谷)的科学家证明,太赫兹拉曼光谱仪可用于定量监控共晶体的形成。 具体来说,他们研究了卡马西平和对氨基苯甲酸通过反应结晶法 (RCM),以乙醇为溶剂,形成的比例为 1:1 和 2:1 的共晶体。 使用光纤耦合至浸入式探头的光谱仪并基于多元曲线解析 (MCR) 进行数据拟合,可实时获得太赫兹拉曼数据。 除了对定量样品进行分析外,他们还表明,该技术可用于跟踪具有不同化学计量方式的共晶体间的转换,并确定反应速率和到达终点的时间,证实了太赫兹拉曼光谱(一个共晶过程中实时且有用的过程分析工具)的效用。

thz-raman-pharma-figure-3.jpg

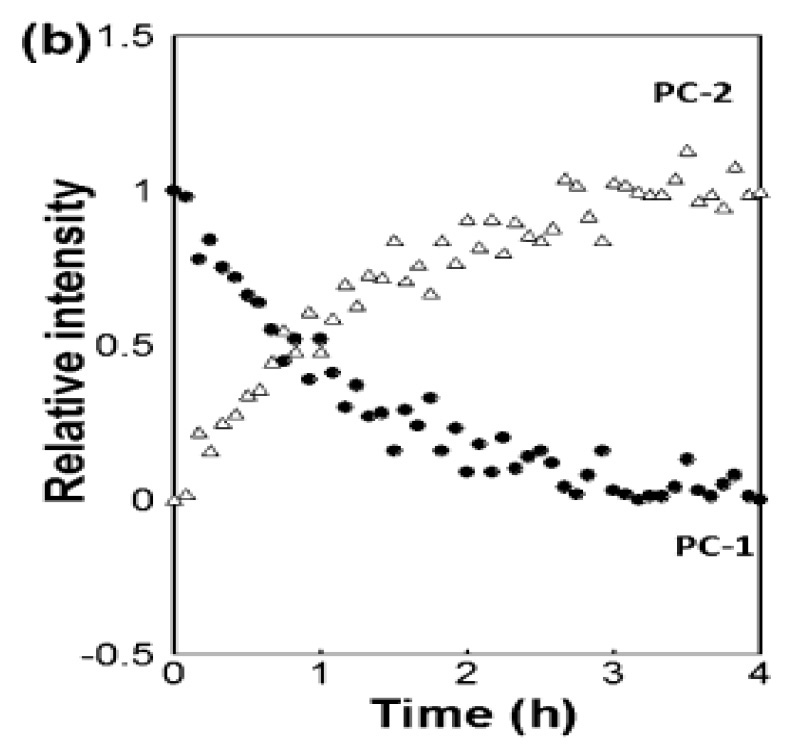
图 3:基于太赫兹拉曼光谱数据的 MCR 拟合,实时监控卡马西平和对氨基苯甲酸构成的比例为 1:1 的共晶体转换为比例为 2:1 的共晶体 经许可转载自 [3]。

Crystallinity vs. Amorphous Monitoring

The low frequency Raman spectrum is dominated by sharp peaks due to crystal lattice modes and optical phonons, which means that a THz-Raman analyzer can measure the concentration of a particular crystal in a mixture of phases, i.e., act as a “crystallinity monitor” [4] The gold standard in crystal identification is powder x-ray diffraction (PXRD) which produces data in the form of a pattern of bright spots at specific diffraction angles based on the lattice properties of the material. However, amorphous materials produce a broad halo of diffracted x-rays due to their semi-random, disordered orientation of molecules, which acts as a noise floor and sets the limit of detection (LOD). This means that it is usually not possible to reliably measure crystallinity content with PXRD, when that content falls below about 5%.

thz-raman-pharma-figure-4.jpg

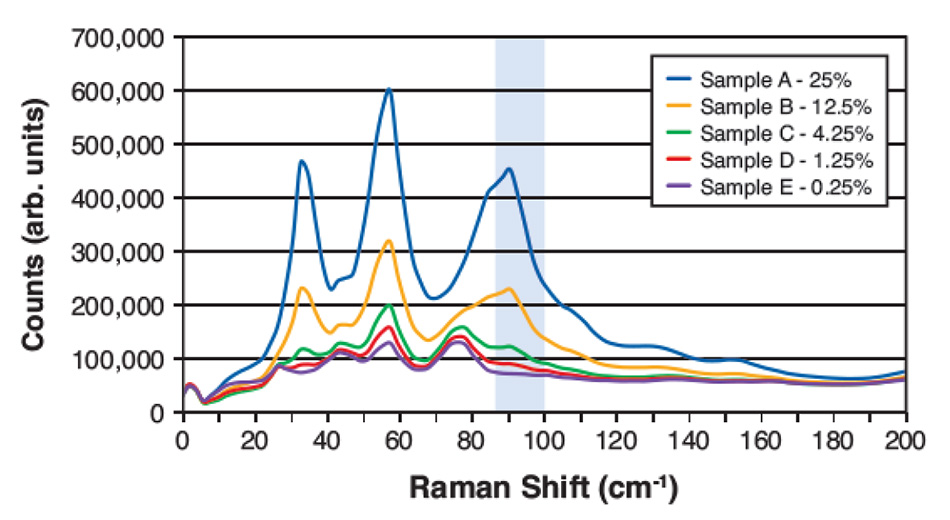
图 4: 太赫兹拉曼光谱,用于测量在甘露醇中的五种不同重量比的对乙酰氨基酚混合物。 高亮区域显示了具有强对乙酰氨基酚信号且与用于计算含量的甘露醇低重叠的区域。

然而,通过太赫兹拉曼光谱,即使在低浓度下,仍然可以明显区分由于晶体成分引发的某些尖峰。 这里的 LOD 取决于选取目标的光谱成分,由于背景材料问题而与光谱特征尽量减少重叠。 图 4 显示了太赫兹拉曼光谱,来自一项最近研究(关于对乙酰氨基酚在甘露醇中的稀释混合物)。 对乙酰氨基酚信号与甘露醇引起的信号的重叠量低,据此选择了高亮频率区域进行拟合。 在考虑到材料间的密度差异并进行背景去除和基线校正后,根据在该光谱窗口上整合的残留信号的数量级,计算出预测的(重量比)浓度。

针对五种不同浓度,使用该简单计算方法得出了计算结果。图 5 显示了计算结果与实际浓度的关系图。 根据该图,确定 LOD 约为 1%,由于样品混合物的局部空间变化,尽管分析区域中光谱特征之间存在一些残留重叠,在低浓度条件下的误差仍然较高。 该 LOD 远远低于 PXRD 的 LOD 典型值,与固态核磁共振 (ss-NMR) 相当。 若将光谱峰间的混合均匀性或分离性较好的材料进行不同组合,LOD 则更低。

thz-raman-pharma-figure-5.jpg

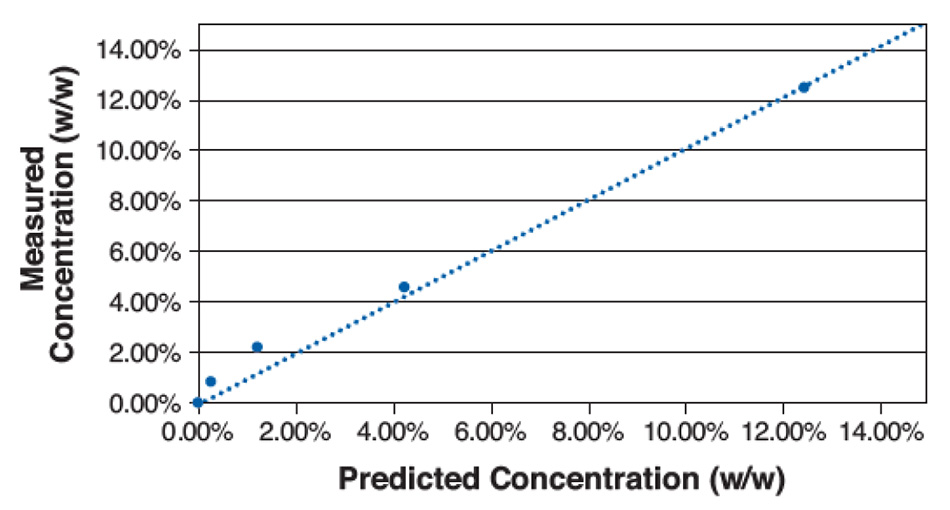
图 5: 甘露醇中多种对乙酰氨基酚混合物的测量浓度与预测浓度的关系图。

Coherent太赫兹拉曼光谱应用实验室其他系统的数据表明,在某些过程监控情况下,即便只进行较简单的分析也能量化结晶度。 具体来说,与非晶态背景的宽玻色子特征相比,晶体峰普遍过于尖锐,通常可以简单地通过分析低频区域的平均光谱导数(斜率)来估算结晶度。

能在实验室和在线实时确定结晶度显然是一个优势,可以广泛适用于制药和化学工业的许多领域。

Multiple Hydrates (Pseudo-Polymorphism)

Pseudopolymorphism refers to crystal phases of the same compound that vary by the amount of solvent material incorporated in the crystal lattice. For example, in the case of aqueous mixtures these take the form of hemi-, mono-, di-, and trihydrate phases, as well as mixtures of these. In another published study [5], scientists at Coherent (formerly Ondax), Meiji Pharmaceutical University (Kiyose, Tokyo) and the Japan National Institute of Health Sciences (Setagaya, Tokyo) demonstrated the ability of THz-Raman spectroscopy to determine the amount of various hydrates in solid samples of magnesium stearate (Mg-St). They noted that previous studies had showed that powder lubrication, densification, and flowability were all different for the monohydrate and dihydrate forms of Mg-St. They also noted that the identification of the magnesium salt, the relative content of stearic acid by gas chromatography, and the water content are collectively not sufficient to uniquely determine the pseudopolymorphism of Mg-St. This uncertainty can be increasingly problematic where global corporations source raw materials from different locations with varying levels of good manufacturing practices.

In this study, 10 samples of Mg-St acquired from different suppliers were analyzed by PXRD as well as thermogravimetry and differential thermal analysis (TGDTA), allowing them to be described by hydrate type(s). Conventional (chemical fingerprint) Raman at high frequencies showed very minor differences between the hydrates. But as shown in figure 6, when each pseudopolymorph of Mg-St was measured using the low-frequency region, there were differences in peaks between 30 and 60 cm−1 and between 100 and 180 cm−1. In particular, a peak in the spectrum of each hydrate was clearly separated in the region between 100 and 180 cm−1, and this enabled discrimination between the monohydrate and the other hydrates even where the Mg-St was a mixture of pseudopolymorphs.

thz-raman-pharma-figure-6.jpg

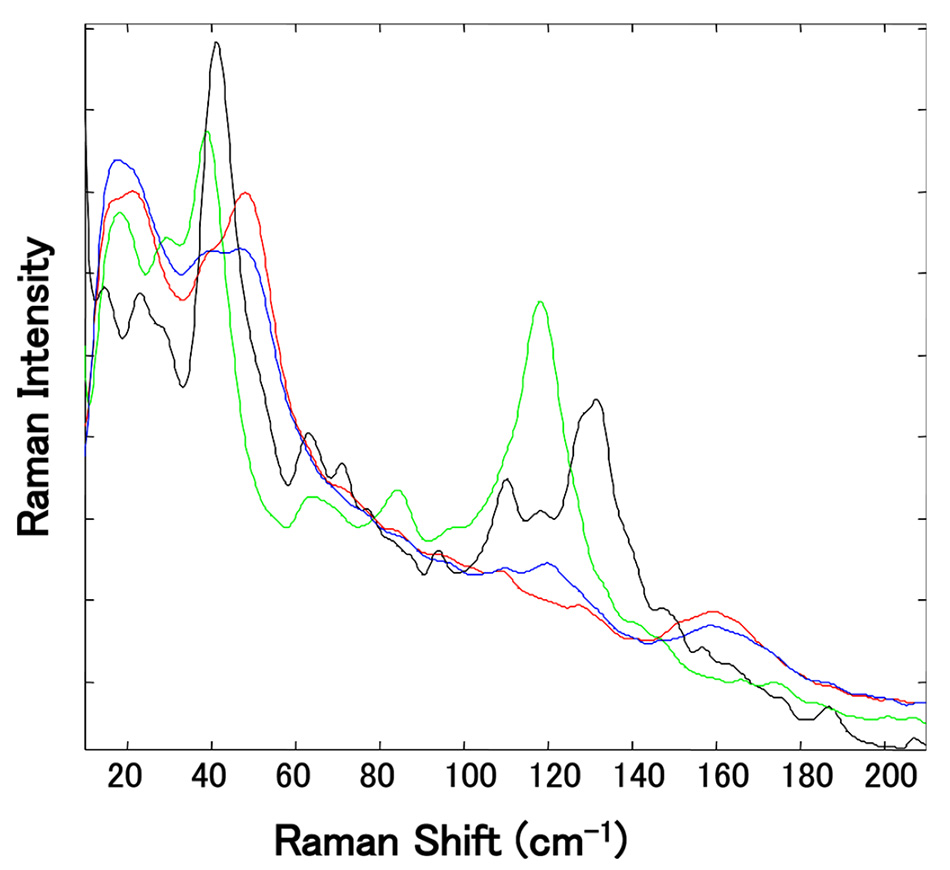
图 6: 若干来源独立的 Mg-St 样品的归一化太赫兹拉曼光谱的放大视图。 (118 cm-1 处出现绿光谱峰是由于存在三水合物,129 cm-1 处出现黑光谱峰则与二水合物有关。) 经许可转载自 [5]。

High-Throughput Screening

The above applications highlight how THz-Raman spectroscopy is a convenient and simpler alternative to PXRD and ss-NMR for rapidly determining the average phase of a sample. Neither of those somewhat cumbersome older techniques can perform spatial mapping. In contrast, the ability to make Raman and THz-Raman measurements through an objective lens supports both adjustment (zooming) and scanning of the sampling area, uniquely enabling mapping (imaging) of a sample under a microscope for both composition and structure/phase. This imaging capability also enables mapping of well plates and mapping within wells for high throughput screening (HTS) applications, and Coherent offers a fully automated well plate reader – the TR-WPS – to provide turnkey analysis for most common well plate formats from 6 to 1536 wells [6].

thz-raman-pharma-figure-7.jpg

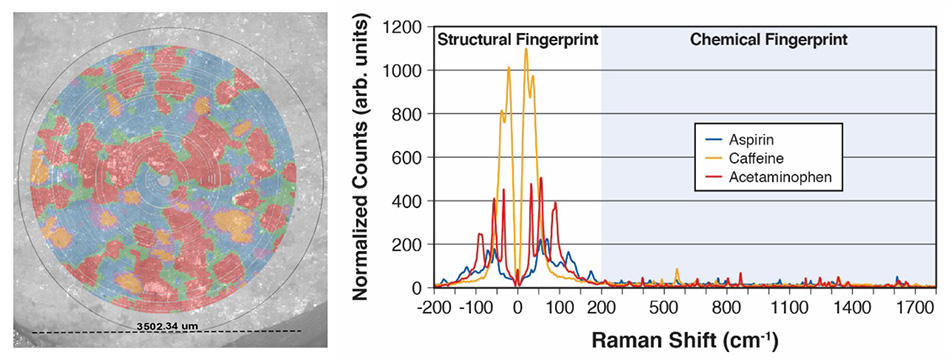
图 7: 埃克塞德林表同时映射了三种 API,以及相应太赫兹拉曼光谱(用于根据主成分分析 (PCA) 和聚类创建该图)。

图 7 显示了假色数据,来自Coherent应用实验室中简单 TR-WPS 演示。 具体而言,将单片 Excedrin® 放置于孔中,并在 9 分钟内在片剂的 3.5 mm 直径区域上收集超过 2.7 万个光谱数据点。 使用主成分分析 (PCA) 和聚类来确定边界区域中的三种成分化合物(对乙酰氨基酚、阿司匹林和咖啡因)以及混合物。 同时使用偏光显微镜 (PLM) 对该区域拍摄 图像,然后覆盖拉曼图以进行视觉比较。 相应光谱清晰地显示了高质量、高数量级数据,以此证明 TR-WPS 能够快速识别和区分材料或多晶型物并且能够捕获视觉和光谱数据。

® Excedrin 是 GlaxoSmithKline 的注册商标


Summary

THz-Raman spectroscopy enables real-time, non-contact analysis of samples, delivering structural information which would otherwise require sample prep and off-line measurements via unwieldy techniques such as PXRD and ss-NMR. It is particularly useful when seamlessly integrated with conventional Raman enabling samples to be simultaneously interrogated for both composition and structure. This survey of several pharma applications illustrates the breadth of potential uses, with benefits that also directly translate into numerous other industries, including polymer sciences, semiconductor materials, and industrial chemicals.


References


    1. P.J. Larkin et al, Polymorph Characterization of Active Pharmaceutical Ingredients (APIs) Using Low-Frequency Raman Spectroscopy, Applied Spectroscopy, Vol 68, Number 7, 2014

    2. Coherent, Inc., Polymorph Identification in Pharmaceuticals, Application Highlights, 2019

    3. M. Inoue et al, Real-Time Formation Monitoring of Cocrystals with Different Stoichiometries Using Probe-Type Low-Frequency Raman Spectroscopy, Ind. Eng. Chem. Res., Vol, 56, #44, 12693–12697, 2017

    4. J. Wallace, Terahertz-Raman Instrument Becomes a Crystallinity Phase Monitor, Laser Focus World, 6, 2020

    5. T. Koide et al, Identification of Pseudopolymorphism of Magnesium Stearate by Using Low-Frequency Raman Spectroscopy, Org. Process Res. Dev., Vol 20, 1906−1910, 2016

    6. Coherent, Inc., High Throughput Screening Using THz-Raman, Application Highlights, 2020


如您有任何需求,请联系我们。