ホワイトペーパー
テラヘルツラマン定量分析の医薬品への応用
概要
THz-Raman™分光法(低周波ラマンとも呼ばれる)は、従来のラマンで収集した200~1800 cm-1までの化学指紋領域に加え、0~200 cm-1までの振動の検出を基本としています。 近赤外分光法や赤外分光法に代表される、使いやすさ、リモートセンシング、直接測定などの利点を持ち、試料の構造や位相に関する情報をリアルタイムに提供する強力な定量分析手段として、近年注目されています。 このような構造および相の情報は、医薬品用途では特に重要ですが、これまでは面倒な試料調製や粉末X線回折(PXRD)のようなより複雑なオフライン手法を使用する必要がありました。 THz-Ramanシステムは、単独で使用することも、既存のラマン装置と統合して低波数領域での感度を向上させることも可能です。 液浸プローブ、サンプルバイアル用の卓上装置、顕微鏡のアクセサリーとして、またハイスループットな検査アプリケーション用のウェルプレートリーダーに組み込んで使用することができます。 このホワイトペーパーでは、製薬業界におけるTHz-Ramanの有用性の幅を強調するために、代表的な用途をいくつか取り上げています。

- 多形体識別
- 再結晶の形成
- 結晶性とアモルファスモニタリング
- 複数の水和物(擬似多結晶体)
- 高スループット検査
多形体識別
多くの医薬品有効成分(API)は、複数の形態(多形)で結晶化することができます。 特に難溶性薬物では、様々な多形が消化管内で全く異なる溶出特性を示し、バイオアベイラビリティ、ひいては有効性に影響を及ぼすことがあるため、この点が重要です。 従来は、多くの薬剤の多型を偶然に、あるいは時間のかかる手作業で検出していました。 今日、コンビナトリアルケミストリーやハイスループット検査による薬物結晶工学は、安定な多形体や水和物、無水物を容易かつ網羅的に同定できるようになっています。 つまり、医薬品の製造においては、開発、製造、品質保証プロセス中の迅速で信頼性の高い多形体識別が不可欠となっています。
多形は、分子組成は同じですが、結晶格子への分子の詰め方が違うだけです。 そのため、従来の光学分析法では、異なる多形を識別するのに苦労していました。 たとえば、FTIR、NIR、従来のラマン分析などは、分子内の振動によるスペクトルピークを測定し、分子組成を示すものです。 そのため、多形解析のアプリケーションでは、粉末X線回折(PXRD)や固体NMR(ss-NMR)などの他の方法に頼ることが多く、捕獲した試料の前処理や複雑な装置組込みが必要でした。 THz-Ramanは、試料の低エネルギー振動を測定し、これらの振動スペクトルピークが主にフォノンモードや格子振動などの分子間振動から生じることから、この用途に理想的であることが示されています。 そのため、THz-Ramanスペクトルは、結晶形の微妙な違いにも高い感度で対応できます。 また、THz-Ramanは特別な試料調製を必要としないため、溶媒使用量を削減するグリーンケミストリーの取り組みにも適合しています。
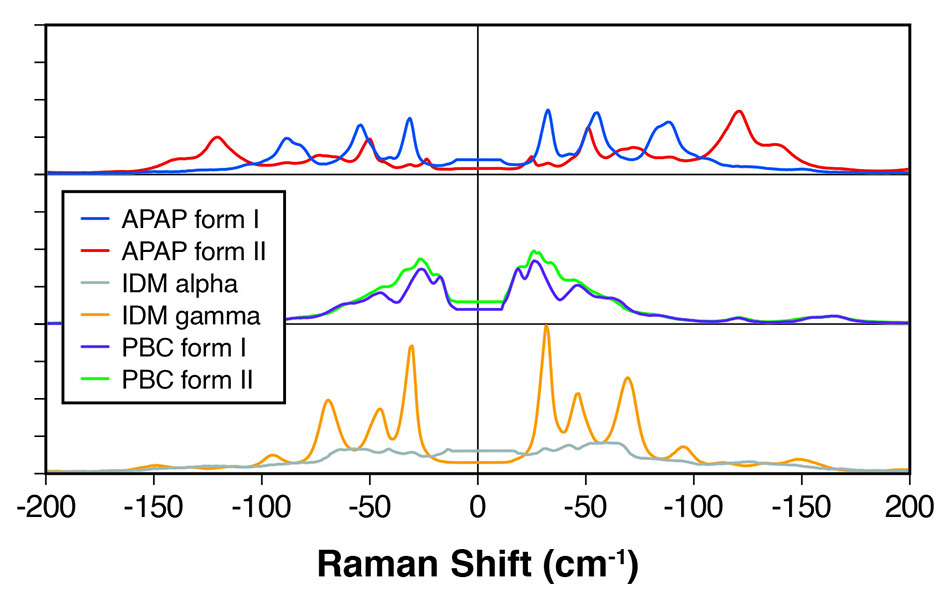
図 1:明確に区別できるピークを示すさまざまなAPIの多形のTHz-Ramanスペクトル。
たとえば、Applied Spectroscopy誌の論文[1]では、Coherent(旧Ondax)とBristol-Myers Squibbの科学者が、カルバマゼピン(CBZ)、カフェイン、テオフィリン、アピキサバンなど、多くの共通するAPIの多形と非晶質を定量的に区別する目的で、THz-Raman分析を使用することに成功したことを実証しています。研究チームは、THz-Ramanがいわゆる光学フォノンを検出し、芳香族分子構造では約130 cm-1(4THz)までの周波数範囲が期待できると説明し、各多形体が格子モードといくつかの低周波(ねじれなど)分子内振動からなる特徴的なTHz Ramanシグネチャーを持っていることを示しました。
関連する研究で、Coherent [2]の科学者は、インドメタシン、プロブコール、アセトアミノフェンなど、他のいくつかのAPIの多形間の明確なスペクトルの違いを示しました。図1を参照してください。同科学者たちは、THz-Ramanシステムが多形の高速で明確な区別を提供し、化学的同定に使用される高周波ラマン「化学的指紋」領域を完全に補完するとまとめました。
共結晶の形成
多形の最適化だけでは、必要な熱安定性や溶出速度などの原薬を製剤化することができない場合があります。 そのため、製薬業界では、これらの特性を変更するために、さまざまなアプローチを開発してきました。 たとえば、原薬の溶解性、安定性、バイオアベイラビリティを調節するために共結晶を使用することが挙げられます。 共結晶は、2つの異なる分子またはイオン化合物の間の水素結合などの弱い分子間相互作用によって形成される分子性結晶です。 また、火薬、農薬、顔料などの分野でも注目されています。 製薬業界では、主に低溶解度原薬に使用されています。
共結晶は、医薬品有効成分(API)といわゆるコフォーマーから構成されています。 同じAPI/コフォーマーの組み合わせでも、異なる化学量論に基づいて、異なる共結晶ができることが多くなります。 たとえば、カルバマゼピン: 4-アミノ安息香酸共結晶系は、1:1、2:1、4:1の化学量論的組み合わせで存在でき、それぞれが特定の溶解速度および他の重要な物理化学的特性を備えています。 共結晶は、固体、スラリー、溶液などさまざまな方法で形成することができ、共結晶の調製は依然として活発な研究分野です。
そのため、特定の共結晶を定量的に同定するための信頼性の高い迅速な方法が、研究からQA、検査、インプロセスモニタリングに至るまで、共通して必要とされています。 従来の光学的手法は共有結合に基づくスペクトルピークに着目したものであり、せいぜい共結晶と混合物、さらに異なる共結晶間の微妙なデータの違いを示すに過ぎません。 粉末X線回折法(PXRD)や核磁気共鳴法(NMR)分光でデータを得ることができますが、試料を採取して準備し、オフラインで測定するためには高価な装置組込みが必要です。 しかし、THz-Ramanは主に分子間振動や格子モードを検出する光学的手法であるため、図2の例に見られるように、この分析課題には非常に適しています。
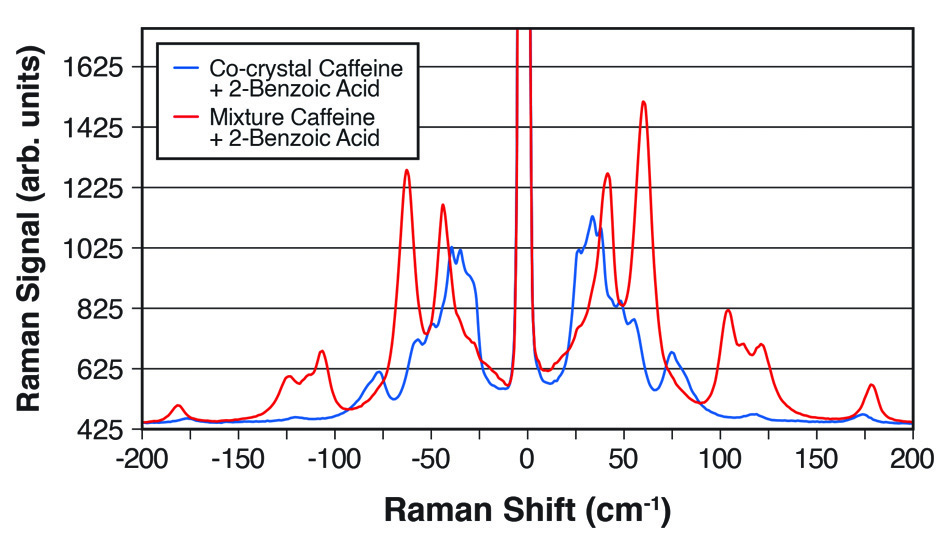
図2:カフェインと2-安息香酸の1:1共結晶と2つの化学物質の単純な混合物の明確な違いを示すTHz-Ramanスペクトル。
Industrial & Industrial Chemical Research [3]に掲載された論文で、Coherent(旧Ondax)、明治薬科大学(東京都清瀬市)、国立医薬品食品衛生研究所(東京都世田谷区)の研究者は、THz-Raman分光器によって共結晶形成を定量的に監視できることを示しました。具体的には、エタノールを溶媒とする反応晶析法(RCM)によって生成するカルバマゼピンと4-アミノ安息香酸の1:1および2:1共結晶を研究しました。THz-Ramanデータは、液浸プローブにファイバー結合した分光器によりリアルタイムで取得され、多変量曲線分割(MCR)に基づくデータフィッティングが行われました。また、試料の定量分析だけでなく、化学量論が異なる共結晶間の変化を追跡し、反応速度や終点までの時間を決定できることも示して、共結晶化プロセスにおけるリアルタイム有用なプロセス解析ツールとしてのTHz-Ramanの有用性が確認されました。
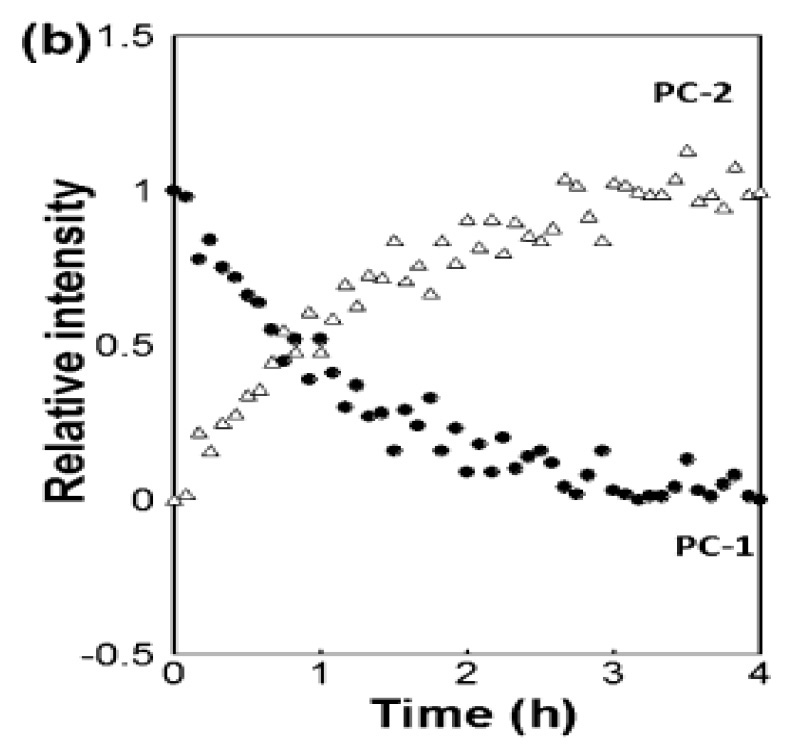
図 3: カルバマゼピンと4-アミノ安息香酸の1:1共結晶から2:1共結晶への変換をTHz-RamanスペクトルデータのMCRフィッティングに基づきリアルタイムでモニタリングしたもの。[3]より許可を得て転載。
結晶性とアモルファスモニタリング
低周波のラマンスペクトルは、結晶格子モードと光学フォノンによる鋭いピークが支配的であるため、THz-Ramanアナライザーは、相の混合物中の特定の結晶の濃度を測定できる、すなわち「結晶性モニター」として機能することを意味します[4]。結晶の同定には、粉末X線回折法(PXRD)が用いられています。PXRDでは、材料の格子特性に基づいて、特定の回折角における輝点のパターンという形でデータを得ることができます。 しかし、非晶質材料は、分子の配向が半ランダムで無秩序であるため、回折したX線に広いハローが発生します。これが光ノイズフロアとして作用して検出限界(LOD)を決めてしまいます。 つまり、結晶化度が5%程度以下になると、PXRDによる信頼性の高い測定は通常不可能です。
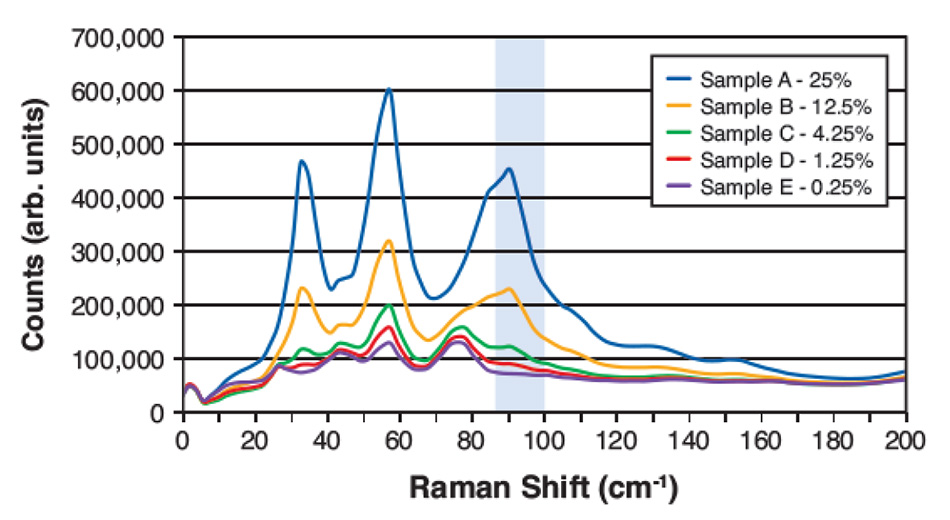
図4:アセトアミノフェンとマンニトールの重量比の異なる5種類の混合物のTHz-Raman分光スペクトル。ハイライトされた領域は、アセトアミノフェンのシグナルが強く、含有量算出に使用したマンニトールとの重なりが少ない領域を示しています。
しかし、THz-Raman分光法では、低濃度でも結晶成分によるシャープなピークのいくつかが明確に区別できます。ここで、LODは、背景物質によるスペクトル特徴との重複を最小限に抑えた、ターゲットに起因するスペクトル成分を選択することに依存します。図4は、マンニトール中のアセトアミノフェンの希薄混合物の最近の研究からのTHz-Ramanスペクトルを示しています。アセトアミノフェンの信号とマンニトールによる信号の重なりが少ないことから、ハイライトされた周波数領域がフィッティングの対象として選ばれました。材料間の密度差を考慮し、バックグラウンド除去とベースライン補正を行った後、このスペクトルウィンドウで積分した残留シグナルの大きさに基づいて、予測(重量比)濃度を算出しました。
図5は、この単純な計算による5種類の濃度について、計算値と実際の濃度をプロットしたものです。このプロットに基づき、LODは約1%と決定されました。低濃度では、サンプル混合物の局所的な空間的変動により、また分析領域ではスペクトルシグネチャー間の重複が残っているにもかかわらず、高い誤差が生じました。これはPXRDの典型的なLODをはるかに下回り、固体NMR(ss-NMR)と同等です。混合物の均一性またはスペクトルピーク間の分離が優れている材料のさまざまな組み合わせでは、LODがさらに低くなります。
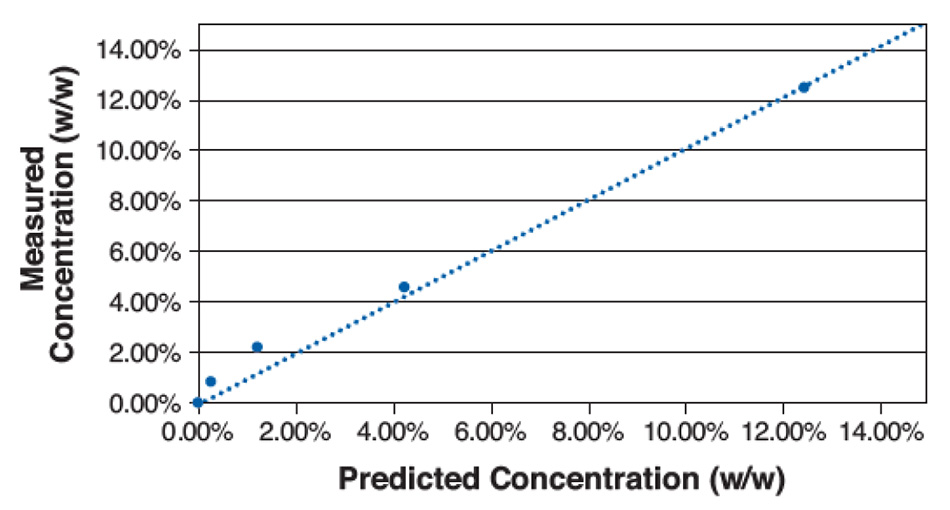
図5:マンニトール中のアセトアミノフェンのさまざまな混合物に対する濃度測定値と濃度予測値のプロット。
Coherent THz-Raman分光アプリケーションラボの他のシステムからのデータは、プロセスモニタリングのケースでは、より単純な分析でも結晶化度を定量化するのに十分であることを示しています。具体的には、非晶質背景の幅広いボソン特徴に比べ、結晶性ピークは普遍的にシャープであるため、低周波領域の平均スペクトル微分(傾き)の分析だけで結晶性の程度を近似的に知ることができる場合がよくあります。
研究室内とオンラインの両方でリアルタイムに結晶性を測定できることは、製薬/化学産業の多くの分野に広く適用できる利点であることは明らかです。
複数の水和物(擬似多結晶体)
疑似多形性とは、同じ化合物でも結晶格子に取り込まれる溶媒物質の量によって結晶相が異なることを指します。 たとえば、水性混合物の場合、これらは半水相、一水相、二水相、三水相、およびこれらの混合物の形をとります。 別の研究で[5]、Coherent(旧Ondax)、明治薬科大学(東京都清瀬市)、国立医薬品食品衛生研究所(東京都世田谷区)の研究者は、THz-Raman分光法によってステアリン酸マグネシウム(Mg-St)の固体試料中の様々な水和物の量を測定できることを証明しました。 研究者たちは、これまでの研究で、Mg-Stの一水和物と二水和物では、粉体潤滑性、緻密化、流動性のすべてが異なることが分かっていたことに注目しました。 また、マグネシウム塩の同定、ガスクロマトグラフィーによるステアリン酸の相対的含有量、水分量を総合しても、Mg-Stの擬似多形を一意に決定するには不十分であることを指摘しました。 この不確実性は、グローバル企業にとって、製造規範のレベルが異なる様々な地域から原材料を調達する際に、ますます問題となる可能性があります。
この研究では、異なるサプライヤーから入手した10種類のMg-St試料を PXRD と熱重量分析および示差熱分析(TGDTA)により分析し、水和物の種類ごとに説明できるようにしました。 高周波での従来の(化学的指紋)ラマンは、水和物間で非常に小さな違いを示しました。 しかし、図6に示すように、Mg-Stの各仮性多形を低周波領域で測定すると、30〜60 cm−1と100〜180 cm−1の間にピークの違いが見られる。 特に、各水和物のスペクトルは100~180cm-1の領域に明確にピークが分離しており、Mg-Stが擬多形の混合物であっても一水和物と他の水和物の識別が可能でした。
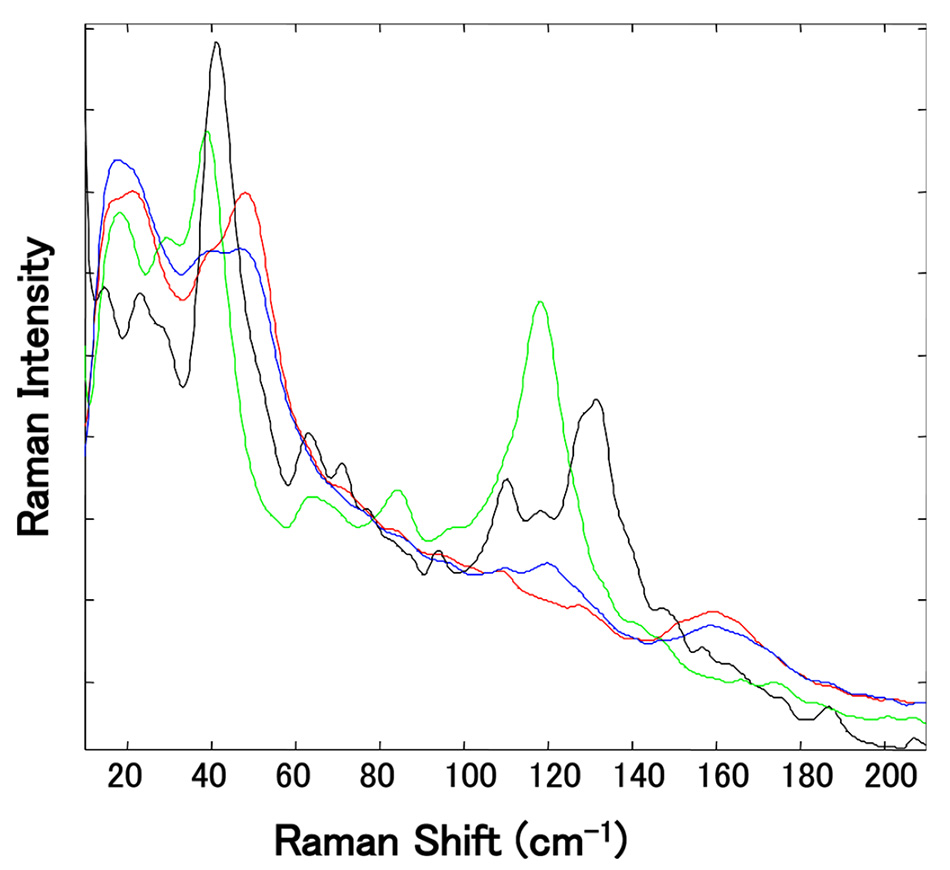
図6:独立した複数のMg-Stサンプルの規格化されたTHz-Ramanスペクトルの拡大図。(118 cm-1の緑色のピークは三水和物、129 cm-1の黒いピークは二水和物に関連しています。)[5]より許可を得て転載。
高透スループット検査
上記のアプリケーションは、THz-Raman分光が、PXRDやss-NMRに代わる、試料の平均位相を迅速に決定するための便利でシンプルな方法であることを強調するものです。 そのいずれもやや面倒な旧来の手法で、空間マッピングを行うことはできません。 一方、対物レンズによるラマン測定やTHz-Raman測定は、サンプリングエリアの調整(ズーミング)とスキャニングの両方に対応しており、顕微鏡下で試料の組成と構造や相のマッピング(イメージング)を可能にするユニークな機能です。 また、このイメージング機能により、高スループット検査(HTS)アプリケーションにおけるウェルプレートのマッピングやウェル内のマッピングが可能になります。Coherentでは、6~1536 ウェル[6]に対応する全自動ウェルプレートリーダーTR-WPSを提供しています。
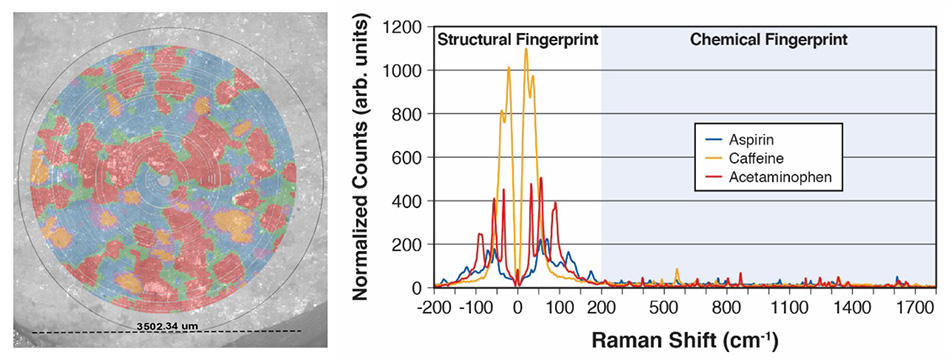
図7:3つのAPIを同時にマッピングしたExcedrinの表と、主成分分析(PCA)とクラスタリングに基づいてこのマップを作成するために使用した対応するTHz-Ramanスペクトル。
図7は、Coherent応用研究所のTR-WPSの簡単なデモによるフォールスカラー(偽色)データです。具体的には、Excedrin®の錠剤1錠をウェルに入れ、錠剤の直径3.5 mmの領域で27,000点以上のスペクトルデータを9分間で収集しました。主成分分析(PCA)とクラスタリングを使用して、3つの構成化合物(アセトアミノフェン、アスピリン、カフェイン)と境界領域の混合物を特定しました。偏光顕微鏡(PLM)画像は、その領域で同時に撮影され、視覚的に比較するためにラマンマップでオーバーレイされました。対応するスペクトルは、高品質で強力な光度データを明確に示し、TR-WPSによって素材または多形を迅速に特定し識別して、視覚データとスペクトルデータの両方をキャプチャできることを示しています。
®ExcedrinはGlaxoSmithKlineの登録商標です。
概要
THz-Raman分光法は、非接触でリアルタイムに試料を分析することができ、PXRDやss-NMRのような扱いにくい技術では、試料を準備しオフラインで測定する必要があった構造情報を提供することができます。 特に、従来のラマンとシームレスに統合することで、試料の組成と構造の両方を同時に調べることができるようになるため、とても便利です。 医薬品の用途をいくつか紹介すると、ポリマーサイエンス、半導体材料、工業薬品など、他の多くの産業にも直接役立つ、幅広い用途の可能性があることがわかります。
参考資料
1. P.J. Larkin et al, Polymorph Characterization of Active Pharmaceutical Ingredients (APIs) Using Low-Frequency Raman Spectroscopy, Applied Spectroscopy, Vol 68, Number 7, 2014
2. Coherent, Inc., Polymorph Identification in Pharmaceuticals, Application Highlights, 2019
3. M. Inoue et al, Real-Time Formation Monitoring of Cocrystals with Different Stoichiometries Using Probe-Type Low-Frequency Raman Spectroscopy, Ind. Eng. Chem. Res., Vol, 56, #44, 12693–12697, 2017
4. J. Wallace, Terahertz-Raman Instrument Becomes a Crystallinity Phase Monitor, Laser Focus World, 6, 2020
5. T. Koide et al, Identification of Pseudopolymorphism of Magnesium Stearate by Using Low-Frequency Raman Spectroscopy, Org. Process Res. Dev., Vol 20, 1906−1910, 2016
6. Coherent, Inc., High Throughput Screening Using THz-Raman, Application Highlights, 2020