WHITE PAPER
Emerging Applications of THz-Raman Analyzers
Overview – Nanostructure Analysis
THz-Raman™ spectroscopy is a relatively new analytical modality that is unique among optical spectroscopic methods in providing unambiguous and quantitative data about the nanoscale structure of samples, in real time and with no special sample preparation required. It is therefore an ideal tool for virtually any R&D, process monitoring or QC/QA application, where the functional performance depends not just on the chemistry of the sample but also on its nanoscale structure. These applications include colloids where particle size can be critical, polymers where crystallinity and layer thickness determine physical (e.g., tensile strength, flowability) properties, liquid crystal display technology where molecular alignment determines light transmission efficiency, quantum dots for displays, solar, and other photonic applications where the size of the dots determines performance, as well as other 2D materials such as perovskite films where film thickness is a key parameter governing photonic functions. The ability to make these measurements using simple push button analyzers and even in-process through a glass window without special sample preparation or complex instrumentation are major advantages for THz-Raman over non-spectroscopic techniques such as powder X-ray diffraction (PRXD). As described in detail in an earlier whitepaper, Pharma Applications of THz-Raman Quantitative Analysis, THz-Raman has rapidly gained acceptance in the pharmaceutical industry, for example where polymorphic or cocrystal details directly impact dosing levels. In this whitepaper we take a look at some interesting new applications in other industries and technologies.
- Polymers* and Copolymers*
- Semiconductor Nanocrystals (Quantum Dots)
- Perovskite Films*
- 2D Materials*
- Luminescent Organic Crystals (Rubrene)
- Liquid Crystals
- Colloids
- Adhesives Curing*
- Illicit Material Source Attribution
- Oxygen Leak Monitoring
*Example data presented in this whitepaper
Some THz-Raman Background Information
THz-Raman spectroscopy (also called low-frequency Raman) is a type of vibrational spectroscopy. While traditional techniques like FTIR and conventional Raman detect intramolecular vibrations, THz-Raman detects larger scale vibrations which naturally occur in a much lower frequency domain, roughly 0.15 THz to 6 THz (i.e., 5 cm-1 to 200 cm-1), These vibrations include lattice vibrations in solids, i.e., phonons, deformations of biomolecular entities such as proteins and even viruses, motions of polymer chains, vibrations of large particles like colloids, “breathing” movements of thin layers, and so forth. So, these vibrational modes provide information about the size, shape, conformation and order of samples, including local phase (crystalline vs. amorphous). In addition, the ratio of anti-Stokes to Stokes shifted Raman peaks indicate the populations of these lower lying vibrational states, yielding Boltzmann temperature data about the sample.
A comprehensive discussion of the THz-Raman spectroscopic method is available in an earlier whitepaper, An Introduction to THz-Raman Spectroscopy. Although the study of THz vibrations has long been known to deliver a wealth of unique information, THz-Raman was historically challenging due to the problem of separating the weak Raman-scatter light from the more intense (Rayleigh) scattered light at the original wavelength. Ondax (now Coherent) engineers solved this challenge with a new type of glass filter called a volume Bragg grating or VBG. Together with the company’s laser expertise and vertical integration, this allowed Coherent to offer a comprehensive range of THz-Raman tools. These range from components to turnkey modules that extend existing Raman spectrometers to the THz regime, to microscope modules, benchtop analyzers for conventional sample vials, immersion probes for at-line analysis of powders and liquids, to complete research-grade spectrometers. This product line provides a common and user-friendly platform for the research lab, R&D applications development, process monitoring, and sample QC/QA.
The following diverse examples are just a few of the numerous emerging applications that can benefit from the unique data now available with these THz-Raman tools.
Polymers
High Density Polyethylene’s (HDPE) commercial appeal lies not only in its cost competitiveness but also its wide-ranging versatility. For example, HDPE’s structural properties can be modified via annealing to affect the long-range order over a certain critical distance, known as the lamellar thickness. Varying the annealing method leads to changes in the lamellar thickness and the degree of crystallinity, which can directly affect the mechanical performance of the plastic. This variability makes it useful in applications from milk jugs and bottle caps to plastic bags and plastic lumber.
Traditional spectroscopic methods that target chemical identification are not particularly useful for analyzing these different types of HDPE because they are all the same material. However, THz-Raman is ideal for this type of analysis since it yields data about low-frequency modes that are strongly influenced by phase details such as the degree of crystallinity and lamellar thickness. And because THz-Raman requires no sample preparation and is a non-contact tool, it can be an ideal solution for online or at-line monitoring of changes in polymer structure in real-time.
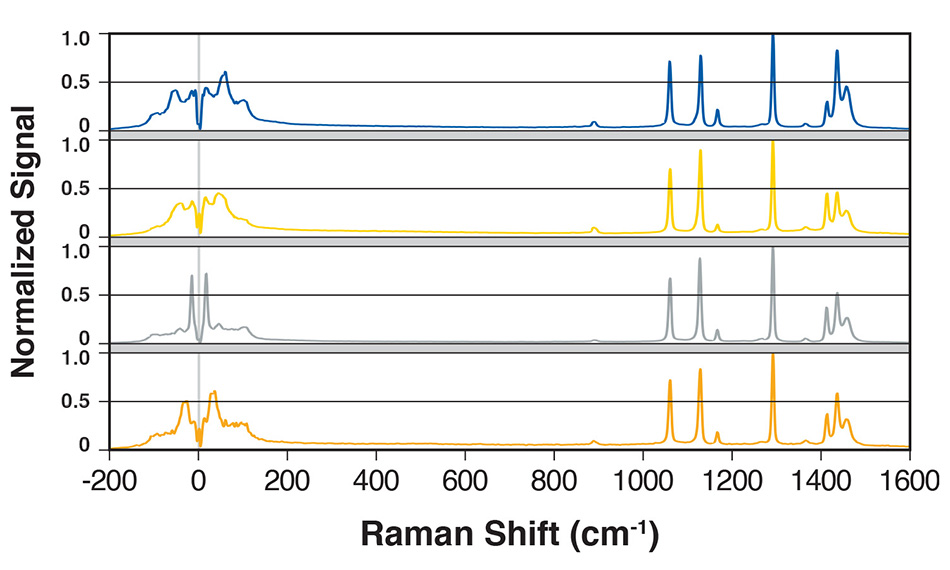
Figure 1: The complete Raman spectra of four HDPE samples with different lamellar thicknesses. The major spectral differences are found in the THz (<200 cm-1) region only. From ref [1].
A recent study of HDPE samples in the spectroscopy applications laboratory at Coherent confirmed the efficacy of THz-Raman for this application using a Coherent TR-Micro-785 analyzer [1]. Figure 1 shows typical complete THz-Raman spectra from this study of four HPDE samples with different lamellar thickness. As expected, the Raman “chemical fingerprint” spectra (from 200 to 2000 cm-1) for these four samples are remarkably similar. However, there is a clear difference in the peak positions and band shape for the THz region (<200 cm-1) which encompasses the longitudinal acoustic modes.
Copolymers
Copolymers are polymers made from more than one type of monomer, where biopolymers are the most common commercial types. These are used in products ranging from automobile tires to stretch fabrics and many common plastic components. Poly[(R)-3-hydroxybutyrate-co-(R)-3-hydroxyhexanoate] or PHBHx is a bio-based and completely biodegradable semicrystalline thermoplastic copolymer with various other attractive properties for commercial applications. A recently published study by Noda et al in Applied Spectroscopy [2] combined mid-frequency Raman and THz-Raman measurements to study the isothermal crystallization of PHBHx. By combining measurements of the mid-frequency CO stretching and the THz lattice modes, these researchers were able to perform hetero-mode correlation analysis to deliver 2D spectroscopic data. (Incidentally, these researchers noted in this publication that the high optical throughput and filtering efficiency (i.e., Rayleigh blocking) of the Coherent probe head enabled them to completely dispense with the holographic notch filter normally integrated within their mid-frequency Raman spectrometer.)
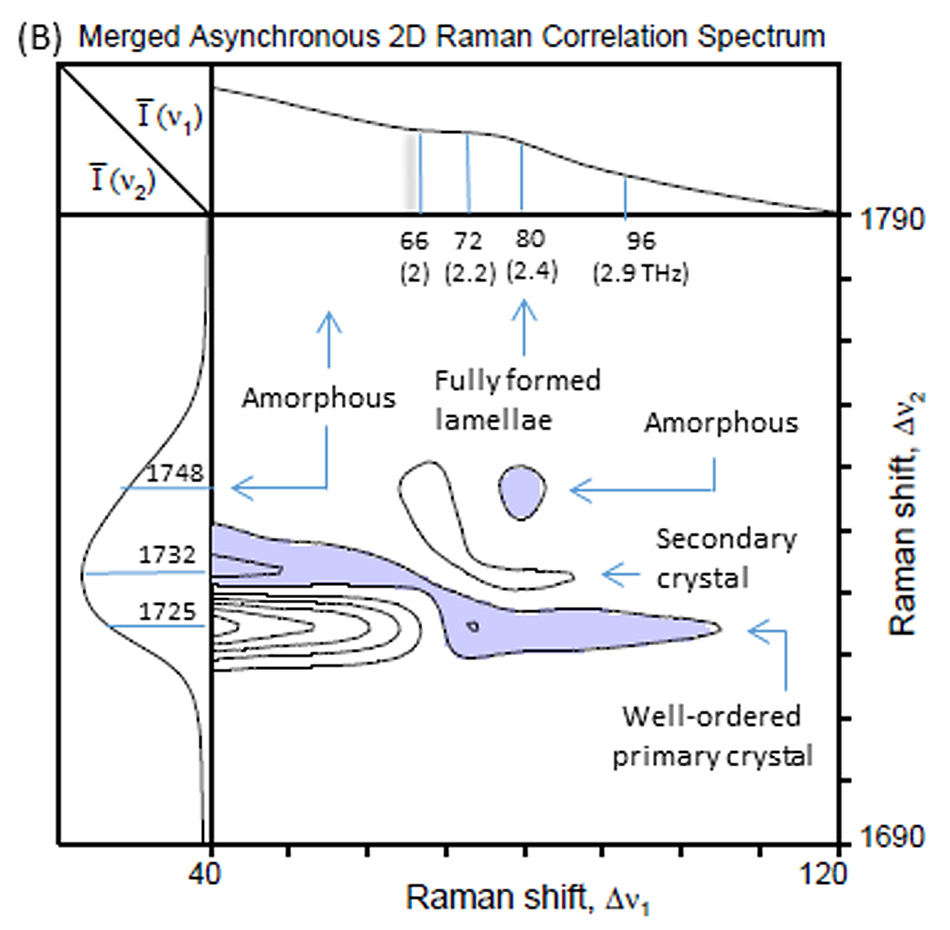
Figure 2: Asynchronous 2D Raman correlation spectrum showing features for the different phases involved in the crystallization of PHBHx. From [2] with permission.
Figure 2 shows an example of a merged asynchronous 2D Raman correlation spectrum obtained in this study. Together with the known spectroscopic information about the low frequency inter and intra-helix vibrational modes in the 66-96 cm-1 window, this allowed spectral features to be clearly assigned to different states of the PHBHx: amorphous material, well-ordered primary crystals, secondary crystals, and fully formed lamellae. By following the evolution of these spectral features in real time, the detailed sequence of the crystallization process was followed for the first time. This type of data can then be exploited to monitor and manipulate the preparation and crystallization of copolymers in order to deterministically optimize physical properties such as elasticity.
Metal Halide Perovskite (MHP) Polymorphs
Perovskite films show great potential for solar, LEDs, photodetectors, and other photonic applications. For example, hybrid lead halide perovskites have already demonstrated solar conversion efficiencies >20%. However, much research is still required to understand their photonic properties in greater detail: in order to ultimately optimize films and devices for efficiency, reliability, and longevity. To this end, a recently published study by Yang et al in Journal of Materials Chemistry C [3] used a Coherent THz-Raman benchtop module to study low frequency vibrational modes in hybrid lead halide perovskites, specifically CsPbIXBr3-X and MAYCs1-YPbI3. This type of information is important because these modes affect the materials’ photonic properties through electron-phonon coupling. Another study of lead-halide perovskites by Guo et al in Nature Communications [4] used low-frequency Raman to help determine the consequence of strong lattice anharmonicity on carrier recombination luminescence.
Figure 3: Low-frequency Raman spectra collected at room temperature. From [3] with permission..
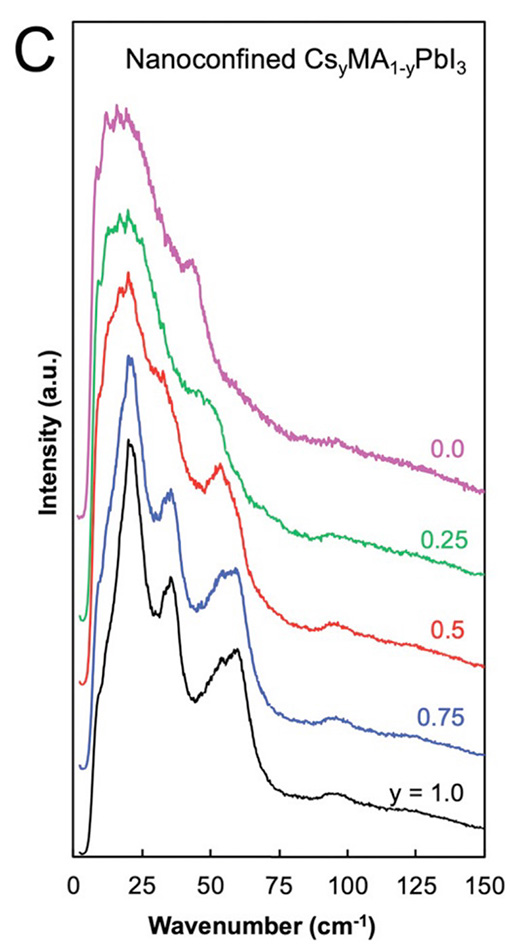
Some of the more interesting polymorphs of these materials such as γ-CsPbI3, are metastable at room temperature, are degraded by moisture, and are degraded by exposure to laser radiation at energies above their bandgap. (Fortunately, the high signal strength of THz-Raman permits the use of lower laser power.) For these reasons, the researchers used a stabilizing template; they deposited the different perovskite materials from solution into the 20–250 nm-diameter cylindrical nanopores of anodized aluminum oxide (AAO) templates. This extrinsic stabilization allowed extended studies using the THz-Raman module. The module was equipped with a 976 nm laser source to avoid fluorescence from the sample but still utilized standard silicon based CCD detectors – see figure 3.
A number of interesting observations and conclusions were made in this study, including observing phase transitions in real time. In particular, chemical substitutions showed that the primary factor governing the energy of lattice vibrations in these series of metal-halide perovskites is the lattice size and not the nature of the ions. Specifically, the peak positions shifted to lower wavenumbers with increasing lattice spacing. This information indicates that considerations of lattice spacing will be key factors as engineers look to manipulate the electron-phonon coupling interactions that impact photonic device efficiencies.
Monitoring Adhesive Curing in Real Time
Ensuring proper curing of epoxies during the manufacturing process is a critical consideration across most manufacturing sectors. Raman spectroscopy is one method that has been employed to monitor epoxy crossing linking process. Most of these Raman measurements have been limited to the chemical fingerprint region between 500 cm-1 and 2000 cm-1, where the spectral peak variations are actually quite small.
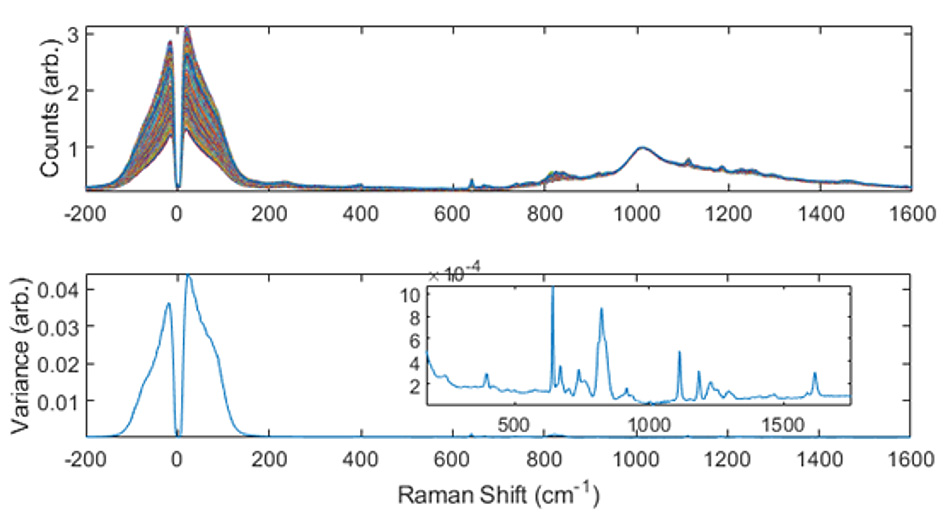
Figure 4: (upper) False color composite of numerous Raman spectra recorded over a 25 minute period for "5 - minute" epoxy. (lower) Plot of spectral variance derived from this data.
A recent study was conducted in the Coherent application lab to evaluate the utility of THz-Raman to monitor the curing process. Several different commercial epoxies were studied with specified cure times ranging from 5 to 120 minutes. After manual mixing, spectra of each sample were acquired using a Coherent TR-Probe (with a 808 nm laser) with the steerable non-contact optic accessory acting as an inverted microscope. Multiple samples were run for each epoxy type, to allow for random variations in mixing etc
Figure 4 shows some typical data from this study – for an epoxy with a nominal 5 minute set time and 1 hour cure time according to the manufacturer. The upper plot uses false color to show the spectra acquired at 1 minute intervals over a 25 minute period. It is immediately obvious from just a glance that the differences are much greater at low (>200 cm-1) frequencies. These Raman signals likely correlate to changes in the bulk shear and breathing modes of the epoxy during cross-linking. The difference is even more dramatic when each spectral series is normalized and converted into a plot of spectral variance. A typical example is shown in figure 4 (lower). Notice that the intensity change (variance) in the chemical fingerprint region (i.e., “conventional” Raman spectrum) has to be scaled up by 2 orders of magnitude to be similar in magnitude to the low-frequency variance!
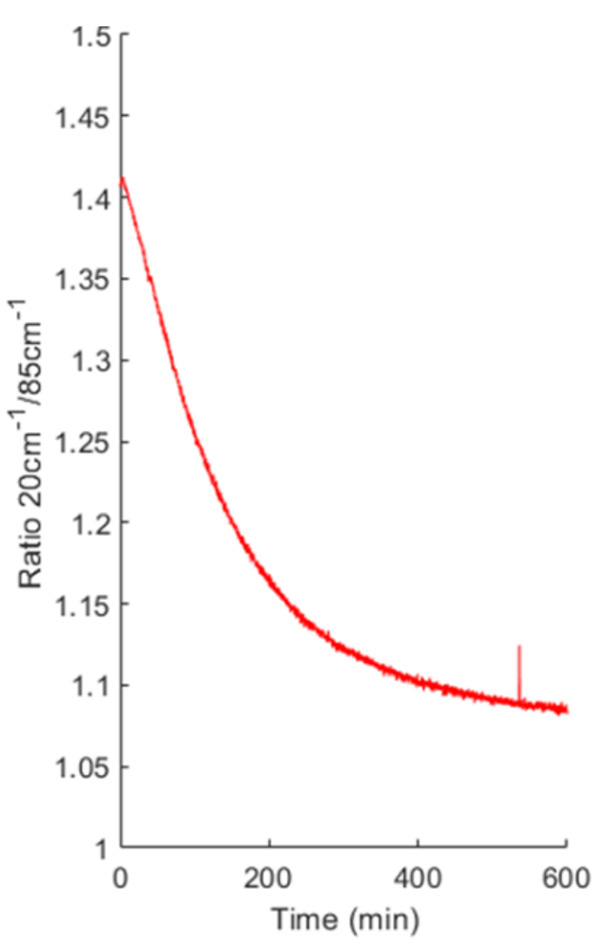
Detailed analysis of several different epoxies indicated that the ratio of the Raman intensities at 20 cm-1 and 85 cm-1 would be a promising metric to monitor the kinetics of the epoxy curing process. Figure 5 shows a plot of this ratio for a sample of a different epoxy, this time a “marine” type adhesive with a nominal 120 minute set time and 24 hour cure time according to the manufacturer. Similar data for different slow and fast curing epoxies in this study further confirm the broad utility of low-frequency Raman data for monitoring epoxies in both aerobic and anaerobic curing conditions. The non-destructive, non-contact and rapid nature of THz-Raman measurements thus makes it is easy to develop customized processes for full set and cure times of these and other industrial adhesives to save time while ensuring a high-quality bond.
Figure 5: A real-time plot of the ratio of the Raman intensities at 20 cm-1 and 85 cm-1 for a manually mixed epoxy with a nominal 120 minute cure time.
Layer Properties in 2D Materials
Single- or few-layered materials, often called 2D materials, have dramatically different properties from their bulk phase. A group of these 2D materials based on transition metal dichalcogenide (TMD) exhibit unique and useful electronic and photonic characteristics. Moreover, these are tunable characteristics that are largely governed by the interactions between the vertically stacked layers, and are affected by the number and orientation of the layers.
Interest in layered 2D systems of a type called van der Waals heterostructures increased even further in 2018 when scientists were able to produce samples of dual graphene layers with a so-called “magic angle” twist of 1.1° between the two layers. As predicted by theory, they found regions of superconductivity that could be turned on and off by just a small voltage.
As applied scientists and device engineers seek to explore these and numerous other examples of interesting 2D materials, a simple tool to analyze and monitor the interaction between the layers can be invaluable. THz-Raman analysis is proving just such a tool. While conventional Raman analysis can reveal the chemical details of the layers, extending Raman into the THz domain provides a direct measuring tool for analyzing inter-layer vibrations. The characteristics of these vibrations then delivers quantitative data on the interaction forces between the layers. THz-Raman is the only analysis modality that provides a simple, non-destructive means of obtaining this data, and requires no sample prep, which can enable direct in situ measurements.
There are two classes of these low-frequency inter-layer vibrations in 2D materials. Vibrations where the layers slide relative to each other with virtually no change in the layer distance are called shear vibrations or shear modes. Whereas vibrations involving movement perpendicular to the layers, i.e., changing the inter-layer distance, are called breathing modes or breathing vibrations.
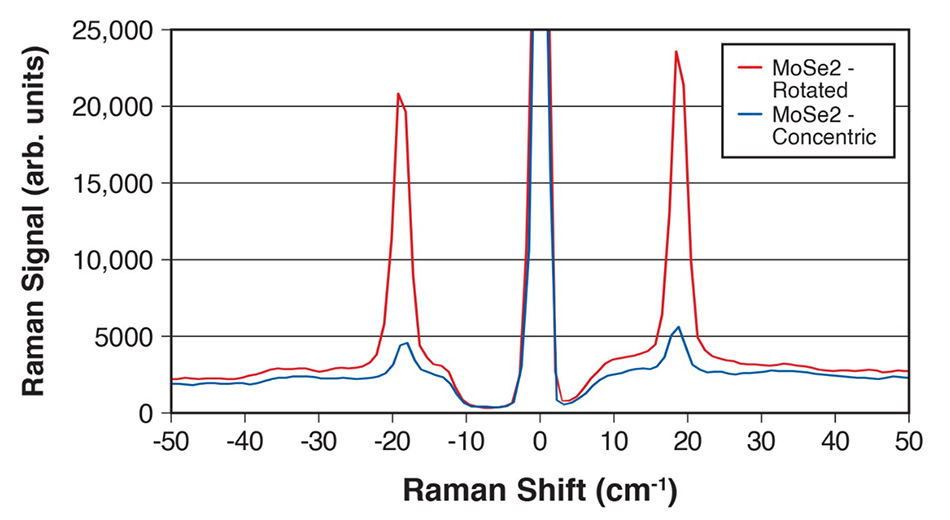
Figure 6: Normalized THz-Raman™ spectra of two-layer MoSe2 materials showing the corresponding shift and change in magnitude of the peak corresponding to the shear mode peak at 18 cm-1 for rotated (red) and concentric (blue) layer orientations. From [4] with permission.
As the number of layers increase from two, the frequency of inter-layer vibrations increases to a plateau value. Consequently, the low-frequency vibrational data can serve as fingerprints to characterize not only the stacking configurations of the layers, but also the number of layers. A recently published study by Puretzky et al in ACS Nano [5] used THz-Raman in this way to investigate two-dimensional metal dichalcogenides in the form of two- and three-layer MoSe2 and WSe2 crystals. The Raman spectral in this study were collected with excitation at 532 nm using a Coherent TR-MICRO-532 THz-Raman system connected to a single-stage spectrometer with a spectral resolution of 1.5 cm-1. Examples of the normalized THz-Raman spectra of shear mode for the two orientations (rotated and concentric) of bilayers of MoSe2 are shown in Figure 6.
Notice that the peak is centered at 18 cm-1 (i.e., 0.54 THz), a very low frequency that would be extremely difficult to detect by any other means.
Other Applications
There are numerous other emerging applications where the nanoscale structure and local phase of samples directly impacts functions. Some of these include semiconductor quantum dots for LED and other photonic devices, luminescent organic crystals (e.g., rubrene, tetracene) and liquid crystals used in some displays, and colloidal suspensions, to name just a few. There are also some applications where the main purpose is trace analysis rather than functional impact. One pf these is detecting air leaks in oil and gas pipelines, taking advantage of the high sensitivity for THz-Raman to detection oxygen. Another is finding signatures of narcotics such as synthetic cannabinoids to determine the source. Even counterfeit detection and prevention of commercially available materials can be improved with THz-Raman. These applications are possible because the same chemical material can have THz-Raman spectra that help identify and differentiate synthetic pathways, ingredients, and formulations, as well as reveal changes relating to environment and storage (e.g., heat, humidity). Each of these factors can leave behind telltale “signatures” or “fingerprints” in the molecular structure that act like water marks to help the forensic specialist in narrowing or accelerating their search for the source.
Summary
THz-Raman is a newly available analytical modality providing the structural and phase data that formerly required cumbersome X-ray diffraction or other complex methods. But it comes with the ease of use of optical spectroscopy, including non-contact, fast analysis, and no special sample preparation. It is uniquely well-suited for any application where function depends on the nanoscale structure, phase, or order/disorder of a material in bulk, trace or 2D material analysis applications.
References
1. Coherent, Inc., Structural Changes in Polymers, Application Highlights, 2017
2. I. Noda et al, Two-Dimensional Raman Correlation Spectroscopy Study of Poly[(R)-3-hydroxybutyrate-co-(R)-3-hydroxyhexanoate] Copolymers, Applied Spectroscopy. Vol 71, Number 7, 2017
3. Y. Yang, Probing lattice vibrations of stabilized CsPbI3 polymorphs via low-frequency Raman spectroscopy, J. Mater. Chem. C. Vol 8, 8896, (2020)
4. Y. Guo et al, Dynamic emission Stokes shift and liquid-like dielectric solvation of band edge carriers in lead-halide perovskites, Nat Commun 10, 1175 (2019).
5. A.A. Puretzky et al, Low-Frequency Raman Fingerprints of Two-Dimensional Metal Dichalcogenide Layer Stacking Configurations, ACS Nano, Vol 9, Number 6, 6333 (2015)