WHITE PAPER
Tunable laser for Dynamical Characterization of Two-Dimensional Materials
Overview
Atomically thin two-dimensional materials are a material platform contending to be the next generation for photovoltaics, quantum information science, and related applications. As such, a thorough understanding of material parameters as well as in-situ characterization during growth and device fabrication, presents a crucial step toward applicability. Transition Metal Dichalcogenides (TMDs) are a subset of these monolayer materials most popular for their semiconducting and opto-electronic applications.
Nonlinear microscopy and spectroscopy combine enhanced spatial resolution with increased sensitivity towards defects, doping, and strain in these materials, while also providing access to sample dynamics, including charge transfer and coherent coupling. The large family of TMDs spans a broad wavelength range with varying resonance energies and linewidths of those resonances. Using the Coherent Vitara T, researchers from the University of Michigan and scientists from MONSTR Sense Technologies demonstrate the capabilities of the BIGFOOT® ultrafast spectrometer and NESSIE® laser-scanning microscope for understanding and characterizing temporal coherence, coupling, charge transfer, and sample quality in TMD monolayers and heterostructures. A schematic and image of the experiment is shown in Fig. 1.

Figure 1: (a) Schematic of the experimental setup: The Coherent Vitara T's laser beam is sent through a pulse compressor for chirp pre-compensation. Subsequently, it passes through the BIGFOOT spectrometer and NESSIE laser-scanning microscope before impinging on the sample inside a cryostat. With its high reliability, the hands-free, turnkey Vitara T is ideal for sophisticated instruments such as the BIGFOOT and NESSIE. (b) Image of the setup with an XY Microscope stage for wafer-scale imaging. Courtesy of MONSTR Sense Technologies.
Ultrafast Movies - a visit to the Quantum Cinema
The basics of ultrafast imaging are illustrated in Fig. 2: A laser pulse, often referred to as the pump pulse, excites a sample. A second pulse, referred to as the probe pulse, follows the pump pulse. During the pump-probe pulse delay, T, the system undergoes an evolution - e.g., exciton decay in direct-gap semiconductors, electron relaxation in graphene, vibrations in molecules and lattices, and charge and energy transfer in photosynthetic bacteria. We understand these ultrafast processes by measuring changes in the system nonlinear response, specifically the four-wave mixing (FWM) signal, as a function of the pulse delay. Combining this measurement with a laser-scanning microscope creates ultrafast “movies” of the sample dynamics.
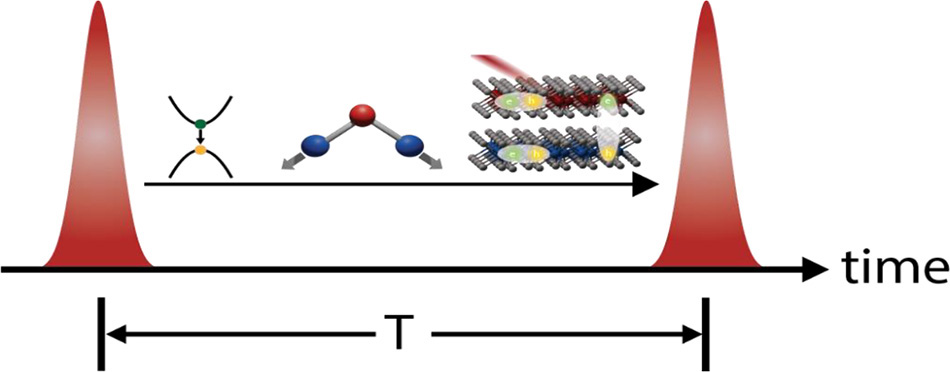
Figure 2: Pump-probe scheme for acquiring ultrafast movies of sample dynamics. Courtesy of MONSTR Sense Technologies.
A measurement at each pump-probe pulse delay is a snapshot of the evolution of the excitation. By spatially scanning the excitation beam over a sample area, we collect a whole frame. We plot an example of such frames in Fig. 3(a). In this example, a monolayer of the TMD MoSe2 displays exciton lifetime decay, as shown by the amplitude decrease with longer pulse delays. A simple exponential fit can extract the lifetime of excitons across the sample, plotted in Fig. 3(b). For semiconductors in particular, the decay time is a strong indicator of changes in doping, localized states (often caused by defects), or changes in the dielectric environment, and hence serves as a probe of the material quality. Pump-probe imaging, however, goes well beyond semiconductors, as it is popular in a wide variety of applications, including detecting malignant melanoma and defects in graphene.
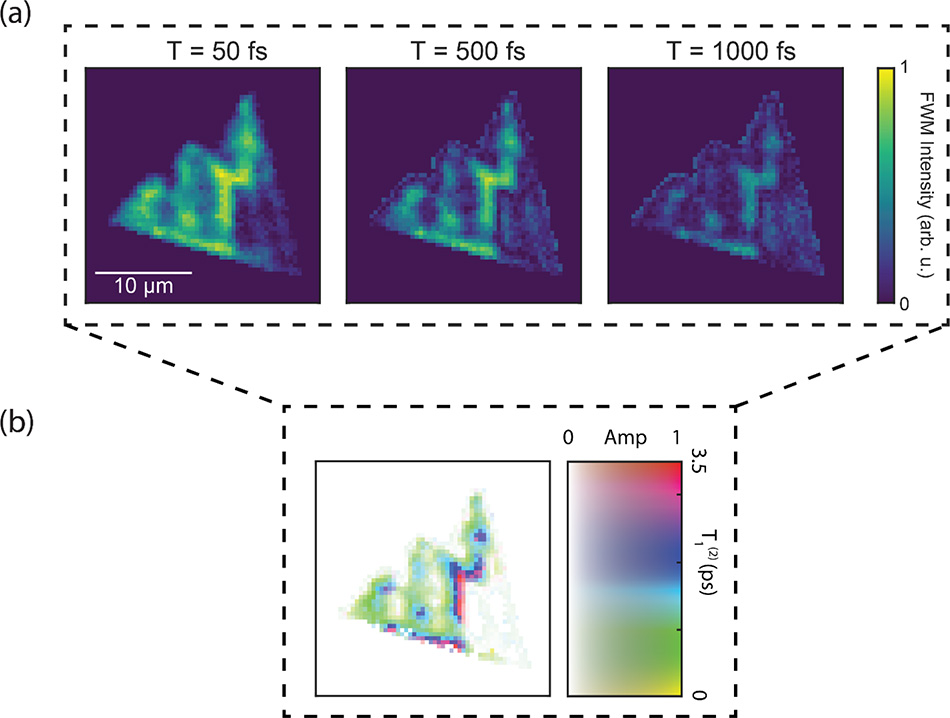
Figure 3: (a) FWM image for varying pump-probe delays T. (b) Resulting decay time image, obtained by exponential fits at each image pixel. Courtesy of Torben Purz.
The spatial resolution of measurements with the NESSIE microscope is better than 800 nm. The high resolution is enabled by the fully-collinear output of the BIGFOOT spectrometer, which can be contrasted with conventional ultrafast techniques that have a spatial resolution of only about 30 µm. Not only does the spot size enable measuring high-resolution images, but it also makes it possible to use high-repetition-rate lasers at 80 MHz instead of amplified laser systems. The more than 30-fold focal spot reduction enabled by BIGFOOT corresponds to a 2500-fold reduction in the excitation area and correspondingly lower pulse energies needed for an equivalent nonlinear response. Therefore, the BIGFOOT spectrometer is compatible with laser oscillators such as the Vitara T, having a high repetition rate and low noise. The benefits are reduced pixel dwell times in imaging and scan durations in spectroscopy, significantly accelerating data acquisition.
The unraveling capabilities of multidimensional coherent spectroscopy
In some instances, researchers require more information about their sample, especially when studying coupling between resonances or accessing their samples' temporal coherence (dephasing) properties. In this case, researchers use multidimensional coherent spectroscopy (MDCS). In MDCS, the probe and pump pulses are spectrally resolved, giving rise to two-dimensional spectra that correlate absorption and emission energies. An exemplary MDCS spectrum for a MoSe2/WSe2 heterostructure is shown in Fig. 4. The two peaks on the diagonal (red dashed boxes) having the same absorption and emission energies are signatures of the MoSe2 and WSe2 A-excitons. The two off-diagonal peaks (yellow dashed boxes) having distinct absorption and emission energies indicate coupling between the excitons. Varying the pump-probe delay reveals the time-dependent nature of the coupling. The broad bandwidth of the Vitara enables simultaneous excitation of both the MoSe2 and WSe2 A-excitons in this experiment. The Fourier Transform spectroscopy approach of the BIGFOOT allows for software-tunable bandwidth and spectral resolution, all at faster data acquisition speeds conventional ultrafast spectrometers.
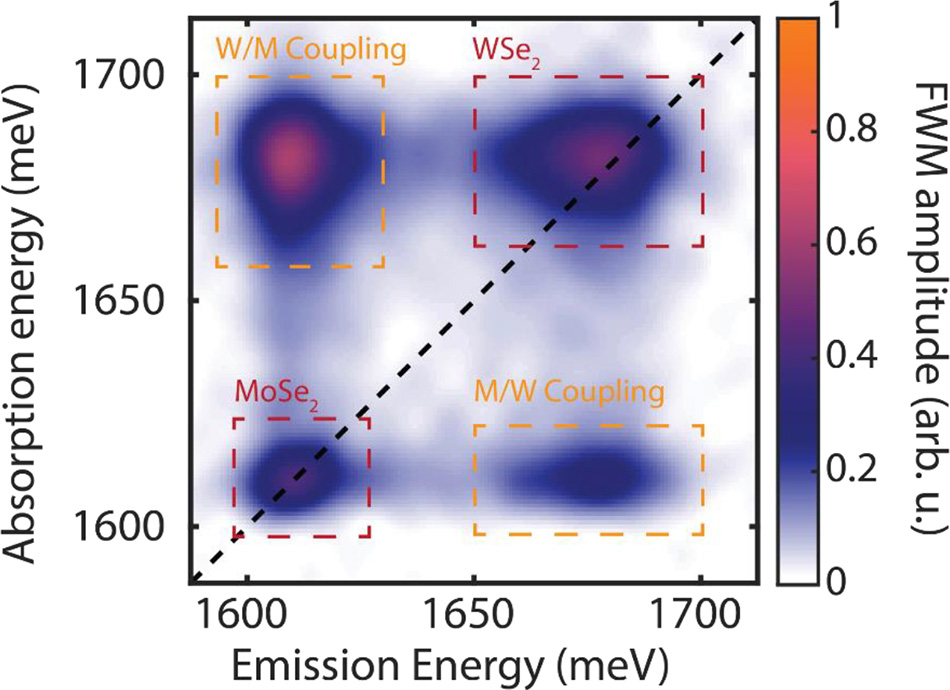
Figure 4: Exemplary MDCS spectrum for a MoSe2/WSe2 heterostructure. Courtesy of Torben Purz.
Accessing Temporal Coherence for Quantum Information Science
Quantum Information Science requires long qubit coherence times for complex computations. MDCS is a useful tool for measuring the optical properties of materials with quantum-information applications due to its unique ability to measure homogeneous linewidths and coupling in materials with large inhomogeneity. MDCS is therefore a great characterization tool for quantum information science. TMDs are a prospective group of quantum materials, yet surprisingly little is known about their coherence times and how they vary across samples. Here we characterize the coherence properties of TMDs using MDCS. A typical nonlinear image of a MoSe2 monolayer at cryogenic temperatures (5 K) is shown in Fig. 5(a).
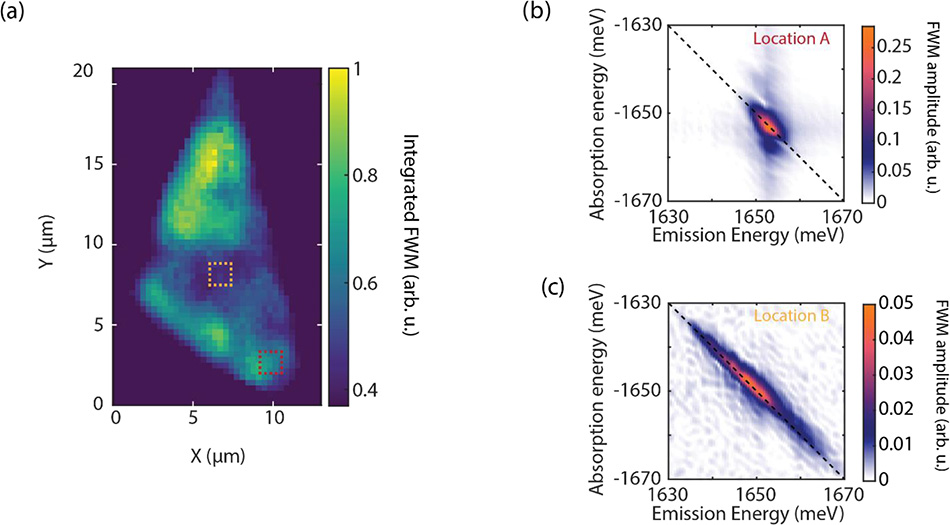
Figure 5: (a) FWM image of a MoSe2 monolayer at cryogenic temperatures (5K). (b) MDCS spectrum at Location A (red dashed box in (a)). (c) MDCS spectrum at Location B (yellow dashed box in (a)) [1].
The monolayer flake displays a significant inhomogeneity in the FWM strength, which coincides with a crack at the center of the sample. Further analysis with MDCS on two sample locations (Fig. 5(b, c)) reveals that the center area also displays a significantly larger inhomogeneous broadening, which manifests as an elongation of the spectrum at Location B along the diagonal (dashed line). The inhomogeneity indicates strong strain-induced resonance shifts for the excitons within the 800 nm excitation region.
A fit of the linewidth across the diagonal quantifies the homogeneous linewidth, which is inversely proportional to the coherence time. For example, the cross-diagonal linewidth fits for Figs. 5(b, c) reveal optical coherence times around 900 fs, which is below the necessary coherence time for a working qubit unless the qubit operations are ultrafast.
MDCS, coupled with microscopy, can also visualize the robustness of coherent coupling between excitons and charge transfer in a MoSe2/WSe2 heterostructure. Integrating over the MoSe2/WSe2 coupling peak (bottom right in Fig. 4) while varying the pump-probe delay results in the coupling images shown in Fig. 6(a). The sample exhibits strong strain, evident from the significant resonance shifts across the sample.
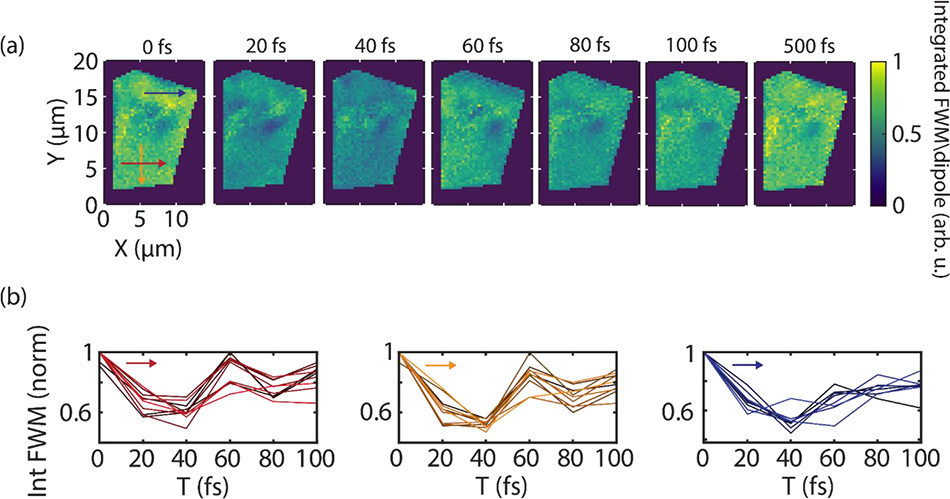
Figure 6: (a) Integrated FWM image of the MoSe2/WSe2 coupling peak (bottom right in Fig. 3) as a function of pump-probe delay T. (b) Integrated FWM as a function of pump-probe delay T along the three arrows in (a) [1].
Fig. 6(a) shows a spatial map of how the coupling peak evolves at a function of the pump-probe delay, T. This is one way we slice this 5-dimensional data set to highlight how to understand the physical nature of interlayer coupling. In 6(b), coupling peak oscillations at early pulse delays reveal the magnitude of coherent coupling in the material. The coupling peak strength at later pulse delays reveals the strength and spatial uniformity of charge transfer. The 6(b) data curves are plotted for many pixels along each colored line in the 6(a) image to show reproducibility of the oscillations at different sample areas.
Despite the short pixel dwell times down to 30 µs for the NESSIE laser-scanning microscope, the full five-dimensional measurements presented here take over an hour to acquire. However, the Vitara’s high stability and low noise, together with high interferometric stability for the BIGFOOT, allow these measurements to yield stable results over hours.
The Road Towards Faster Material Inspection
To enable in-situ characterization during material growth and fabrication, combining full MDCS with microscopy is not sufficiently fast. Instead, MDCS modalities, such as dephasing and population dynamics, can be accessed by zero- or one-dimensional scans in the time domain, which the MONSTR Sense ultrafast microscope acquires in less than a minute. These zero- or one-dimensional scans are often sufficient for in-situ or in-line material growth characterization where throughput is important.
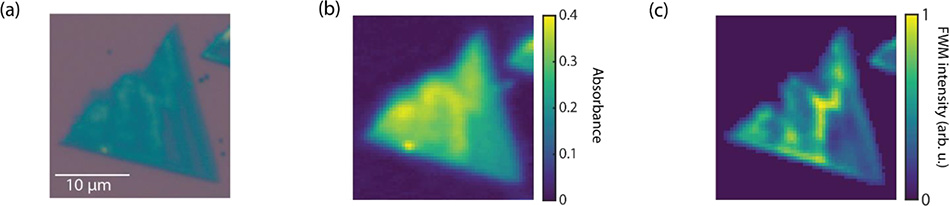
Figure 7: (a) White-light microscopy image of a CVD-grown, non-encapsulated WSe2 monolayer. (b) Absorbance image of the WSe2 monolayer. (c) FWM image of the WSe2 monolayer [2].
Even more so, a simple static FWM image reveals areas with exceptional physical properties, such as dephasing or population lifetimes, while being significantly faster to acquire. A comparison of (a) white-light microscopy and (b) resonant linear reflectance with (c) FWM imaging at room temperature is shown in Fig. 7.
While the white-light microscopy image in Fig. 7(a) and the linear reflectance image in Fig. 7(b) show a spatial inhomogeneity caused by remaining residue from the transfer process, the FWM image in Fig. 7(c) shows a higher contrast and distinct features from Fig. 7(a, b).
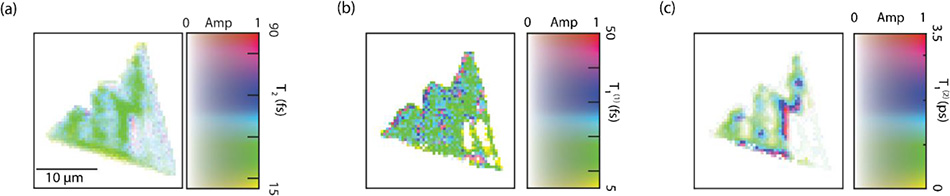
Figure 8: (a) Dephasing time image of the WSe2 monolayer at room temperature (b) Rapid decay component image of the population lifetime. (c) Slow decay component image of the population lifetime [2].
The distinct FWM features translate into different dephasing times, as shown in Fig. 8(a). The pulse duration, set by tuning the broad Vitara T bandwidth and compensating for dispersion, is 30 fs. The areas of significantly higher dephasing times are areas with high many-body effects. Similarly, the bi-exponential decay images shown in Fig. 8(b, c) show similar spatial behavior for the slow decay plotted in Fig. 8(c). The stark distinction in spatial profiles of the fast and slow decay component hints at a spatially varying dark state distribution in this sample.
Summary
We demonstrated an innovative and commercially available set-up for multidimensional coherent spectroscopy coupled with microscopy to study spatially-resolved optical coherence times, coherent coupling between excitons, and charge transfer in a TMD heterostructure. For heterostructure samples, both coherent coupling and charge transfer show a large homogeneity, encouraging larger-scale applications of TMDs for photovoltaics and quantum information applications. It also underlines the power of MDCS with microscopy, which allows researchers to probe their sample dynamics across the sample with high reproducibility. The rapidly acquired dephasing and population lifetime maps indicate sample quality more accurately than white light microscopy or resonant linear reflection.
By calibrating the dephasing and population lifetime scales to a pristine, high-quality sample, any deviation from the expected dynamics can thus indicate inferior sample quality. Furthermore, with these measurements being significantly faster than photoluminescence or Raman, FWM imaging can serve as a rapid, in-situ characterization of TMDs and other two-dimensional materials, gallium arsenide, and much more.
For these measurements, the Coherent Vitara T ultrafast laser is selected for its wide tunability, large bandwidth, high stability with low noise, and ease of use. In addition, MDCS spectroscopy requires simultaneous excitation of all resonances of interest, which is only possible in a TMD heterostructure using a broadband laser such as the Vitara. Spectroscopy and imaging data also demonstrate the capabilities of the BIGFOOT ultrafast spectrometer and NESSIE laser-scanning microscope by MONSTR Sense Technologies. This equipment focuses the laser to a nearly diffraction-limited spot, which enables high resolution and a strong nonlinear response using a laser oscillator.
References
[1] Torben L. Purz, Eric W. Martin, William G. Holtzmann, Pasqual Rivera, Adam Alfrey, Kelsey M. Bates, Hui Deng, Xiaodong Xu, and Steven T. Cundiff. “Imaging dynamic exciton interactions and coupling in transition metal dichalcogenides.” J. Chem. Phys. 156, 214704 (2022).
[2] Torben L. Purz, Blake T. Hipsley, Eric W. Martin, Ronald Ulbricht, and Steven T. Cundiff. “Rapid multiplex ultrafast nonlinear microscopy for material characterization.” Opt. Express 30. (25), 45008–45019 (Dec. 2022). DOI:10.1364/OE.472054.