WHITE PAPER
An Introduction to THz-Raman Spectroscopy
Overview
The terahertz (THz) region of the electromagnetic spectrum, from roughly 0.15 THz to 6 THz (5 cm-1 to 200 cm-1), has long been researched as a means of investigating low-energy vibrational modes of materials. This region is particularly attractive to spectroscopists studying intermolecular vibrations within crystals [1], yielding important information about the molecular orientation that governs many key properties of materials. On the most fundamental level, THz spectroscopy is an extension of far-infrared (FIR) absorption spectroscopy. In practice, it is far more challenging to implement because it is at the extreme low-end of the optical frequency domain and extreme high-end of the frequency domain for electronics. That is why this region of the spectrum is often referred to in the published literature as the “terahertz gap” [2]. Currently, commercial THz spectroscopy systems are available on the market, but most are extremely expensive and difficult to use due to the complexity of the ultrafast lasers typically required to generate THz radiation and susceptibility of samples to moisture.
Fortunately, direct absorption of terahertz radiation is not the only way to access THz-domain vibrational modes as many are also Raman active. Raman scattering results from the inelastic scattering of photons, not absorption, therefore decoupling the excitation wavelength from the vibrational modes under investigation. In traditional Raman, the spectral range of 200 cm-1 to 1800 cm-1 represents the “chemical fingerprint,” since most intramolecular vibrations occur in this frequency range. In a complementary way, the THz-Raman™ (also referred to as low-frequency Raman or LFR) region, from 5 cm-1 to 200 cm-1, provides a “structural fingerprint” that corresponds mainly to inter-molecular vibrations, or lattice/phonon modes of the material. Figure 1 shows the relative wavelength locations where THz spectroscopy (50 μm to 2 mm), IR spectroscopy (5 to 50 μm) and THz-Raman spectroscopy occur within the electromagnetic spectrum. Figure 2 correspondingly shows the relative locations of the chemical and structural fingerprints of a typical Raman spectrum.
Raman spectroscopy historically has been challenging to implement in the THz-domain because the inelastic scattering (Raman shift) is orders of magnitude weaker than the elastic scattering (Rayleigh), making it hard to adequately filter out the Rayleigh scatter. As a result, it was difficult to resolve signals with Raman shifts very close to the Rayleigh line (0 cm-1). This situation completely changed with revolutionary developments in volume holographic notch filters that have made it easy to directly measure Raman shifts as small as 5 cm-1 with just a simple monochromator featuring high optical efficiency [3]. This breakthrough has resulted in a paradigm shift for low-frequency Raman: from a relative novelty requiring complex multistage monochromators, to self-contained spectrometers that any scientist can set-up in a matter of minutes, as well as plug and play add-on modules for existing instruments. For example, these THz-Raman modules include immersion probes for reaction monitoring, microscope platforms for mapping the phase of samples, and well plate readers for high-throughput screening applications.
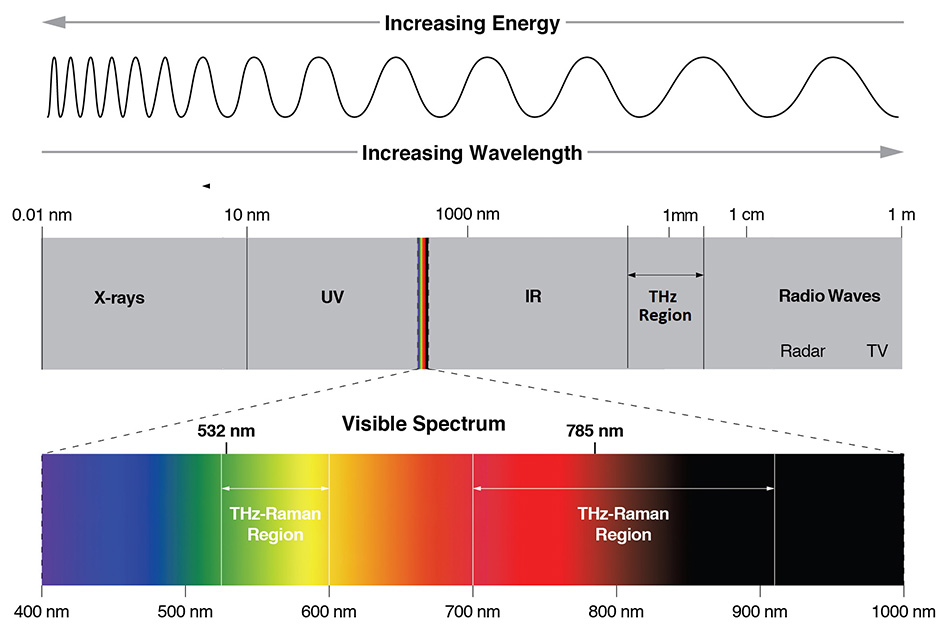
Figure 1: The electromagnetic spectrum showing the locations of different spectroscopy techniques. Raman spectroscopy is typically performed in the visible (532 nm) or NIR (785 nm) while IR absorption spectroscopy occurs from 5 - 50 μm and THz spectroscopy from 50 μm - 2 mm.
THz-Raman System Requirements
Every THz-Raman system has four things in common:
- A wavelength stabilized laser source
- Narrowband (< 5 cm-1) spectral clean-up filters
- Narrowband (< 5 cm-1) Rayleigh scatter blocking filters
- A spectrometer that can detect the low frequency signals
The Rayleigh filter, a +/- 5 cm1 bandwidth notch filter, should be the limiting factor to how low into the THz-domain the system can detect. However, for the Rayleigh filter to function properly, it is critical that the laser’s output spectrum be extremely stable, have a very narrow linewidth, and exhibit extremely low noise from amplified spontaneous emission (ASE) or side bands within the transmission region of the notch filters. It is also essential that the center wavelengths of both the filters and the laser remain “spectrally synchronized” to one another during operation to avoid leaking of the Rayleigh signal and saturation of the spectrometer’s detector. As an integrated manufacturer of lasers, filters and optical systems, Coherent spectrometers and modules are all designed to perfectly maintain this synchronization, ensuring robust, easy to operate performance at all times.
An additional advantage of these systems is that since Raman spectra are measured as a relative shift from the laser frequency, THz-Raman systems can use lasers at any wavelength in the visible or near infrared (NIR) to probe these low-energy vibrational modes, eliminating the need for a THz laser source. This enables a much simpler and less-costly spectral collection scheme, allowing for the use of glass optics and fibers, compact and inexpensive diode and diode-pumped solid-state (DPSS) laser sources, and silicon detectors and detector arrays. THz-Raman systems are also capable of detecting anti-Stokes Raman shifts, less than -5 cm-1, which provide additional information about the sample, including local effective temperature. Therefore THz-Raman systems can simultaneously measure both the chemical and structural fingerprints of materials with high throughput in a single measurement.
The combined benefits of THz spectral information with the ease of use of Raman spectroscopy now make it a powerful solution for applications that are interested in both the chemical and structural properties of materials. THz-Raman has been rapidly adopted by the pharmaceutical industry [4-9] and is also getting traction in polymers [10], semiconductors [11-13], and biomedical diagnostics [14].
Low-frequency Vibrational Modes
As described above, low-frequency peaks result from intermolecular vibrations such as phonon modes and lattice vibrations. In crystalline samples, the position (shift) of the peaks are specific to the composition (chemical and structural) details of the crystal. And the bandwidth and intensity of these sharp low-frequency peaks are directly related to the degree of structure (crystallinity) of the sample. In contrast, amorphous solids and liquids have a broad unresolved peak known as the boson peak. Therefore, the THz-Raman spectrum is a useful tool to quantitatively analyze sample crystallinity and to classify different allotropes and polymorphs. Although polymorphic analysis is a more popular application, it is easier to understand by examining the THz-Raman spectra of different allotropes to better illustrate the properties of low-frequency vibrational modes.
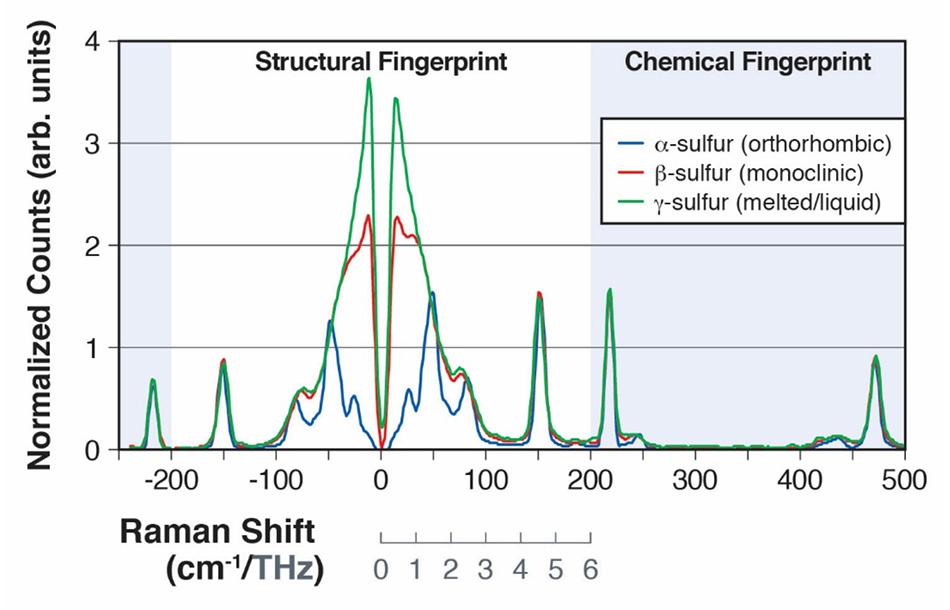
Figure 2: Raman spectra of α-sulfur and β-sulfur, showing the intermolecular vibrational modes from 0 to 200cm-1 (A) and intramolecular vibrational modes from 200cm-1 to 500 cm-1 (B).
Sulfur, which has over 30 allotropes, has been extensively studied due to its importance in a wide range of chemical processes in both life sciences and industrial applications [15]. The allotrope α-sulfur has been shown to have 24 different intermolecular vibrations, many of which are Raman active in the 30 cm-1 - 100 cm-1 region of the spectrum [16]. In a paper presented at the 2013 SPIE Defense, Security, and Sensing conference, Heyler et al. demonstrated how these vibrational modes could be detected using THz-Raman [3]. They went on to show that as the sample of α-sulfur was heated above 95.6°C, it underwent a form change to the allotrope β-sulfur and then liquified at 115.2°C. The transition from the α form (orthorhombic) to the less ordered β form (monoclinic) could easily be detected as the increased disorder leads to a “blurring” of the modes in the Raman spectrum below 100 cm-1 as it approaches more of a boson peak structure [Figure 2]. After melting and forming the y form (liquid), the structural modes in the THz-Raman domain completely meld together showing only the purely boson band typical of an ordinary liquid [17]. In contrast, the modes in the chemical fingerprint region were not significantly affected by the form change as evident when comparing the peak locations of the spectra above 100 cm-1. All the spectra in figure 2, were collected using the Coherent TR-MICRO THz-Raman module attached to an upright microscope and a fiber-coupled spectrometer. A schematic representation of the set-up is shown in figure 3.
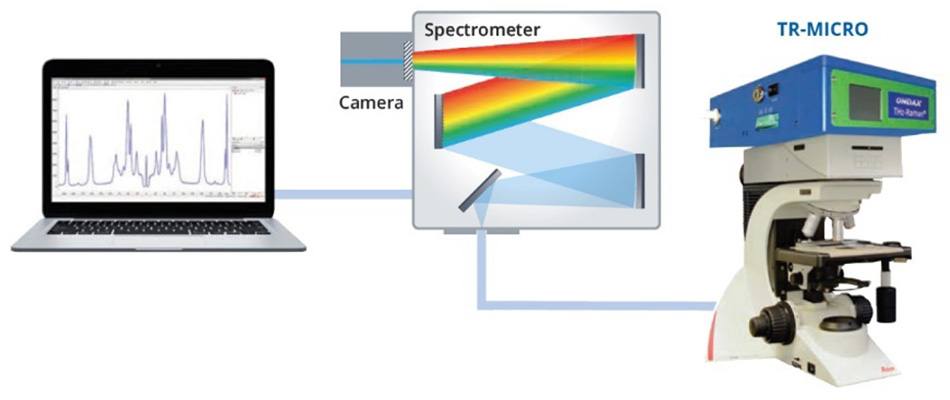
Figure 3: Schematic representation of the experimental set-up used to collect the THz-Raman spectra of α-sulfur and β-sulfur.
The THz-Raman unit contains a single frequency excitation laser, precisely matched to ultra-narrow-band (volume holographic) laser line and notch filters. The notch filters are specifically designed to ensure maximum throughput of the Raman scatter while also attenuating the Rayleigh scatter with an optical density (OD) greater than 9, enabling their use with inhomogeneous samples. Finally, the remaining Raman scatter is coupled to a spectrometer through a fiber optic cable. A more detailed explanation of the optical design is available in the conference proceedings [3].
Applications in Pharmaceuticals
Polymorphism is a critical and common characteristic of active pharmaceutical ingredients (APIs). It has a direct impact on drug substance bioavailability, manufacturability, and quality/performance [18]. Since polymorphic compounds have the same base molecular composition but different bulk structural orientations, THz-Raman is far better suited than conventional infrared (IR) and Raman spectroscopies to determine the polymorphic form. For the sake of completeness, it should be noted that in some cases, polymorphic differences can lead to subtle peak shifts in the chemical fingerprint region of the Raman spectra [19,20] due to damping of intramolecular vibrations. That said, the spectral changes in the low-frequency range tend to be far more pronounced (up to 10x stronger) and more easily differentiable without the need for complex chemometric analysis. Additionally, as Larkin et al. demonstrated in a 2014 article published in Applied Spectroscopy, “Low-frequency Raman spectra of large aromatic species typical of APIs provide remarkably intense bands below 200 cm-1 with complex spectral features [9].” They went on to explain that these bands are typically an order of magnitude more intense than those of the surrounding excipients in the same frequency range, which provides the ability for THz-Raman to directly measure “crystalline structure, crystalline disorder, and amorphous states,” with enhanced sensitivity.
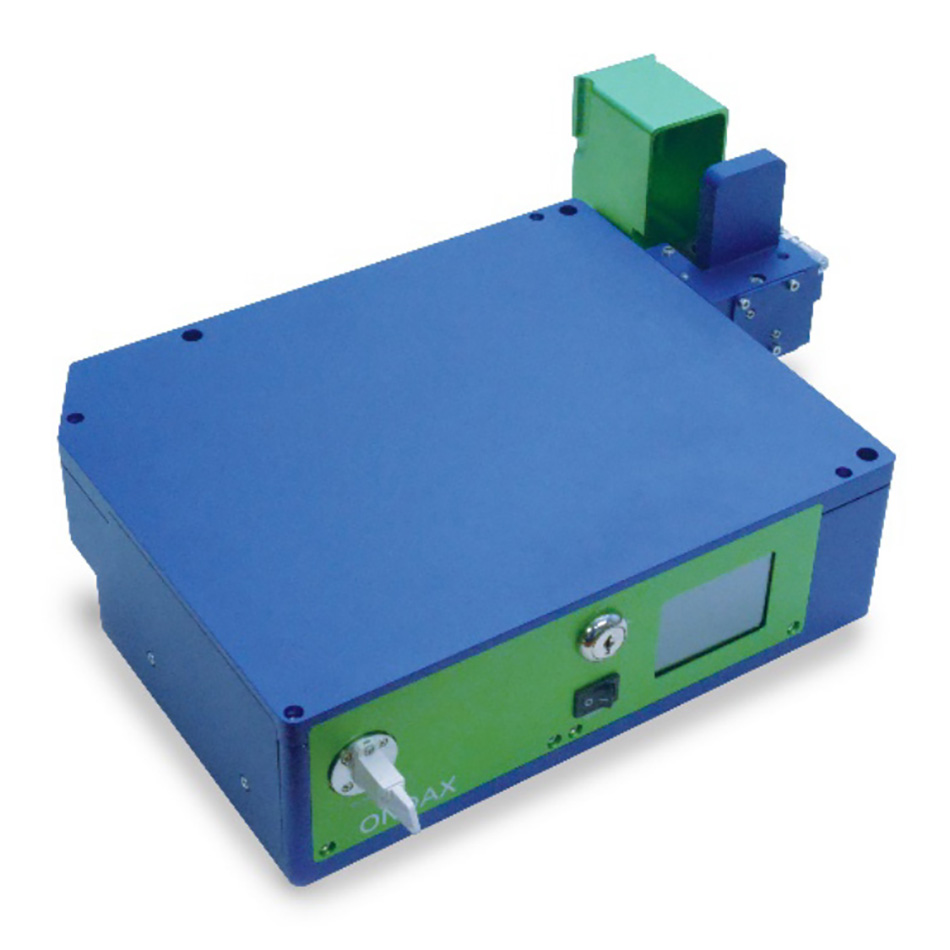
Figure 4: The TR-BENCH, benchtop THz-Raman module from Coherent.
Between the study mentioned above [9] and a follow-up study published in 2015 [10], researchers at Bristol-Myers Squibb have provided a detailed analysis of the low-frequency Raman bands for polymorphs of some common APIs. In those two publications, they analyzed indomethacin, carbamazepine, caffeine, theophylline, and apixaban. Larkin et al. used a benchtop THz-Raman sampling system, similar to the TR-BENCH currently available from Coherent shown in figure 4. The TR-BENCH has the same internal optical architecture as the TR-MICRO discussed in the previous section. As an example of this research, figure 5 shows the THz-Raman spectra of three different forms of carbamazepine.
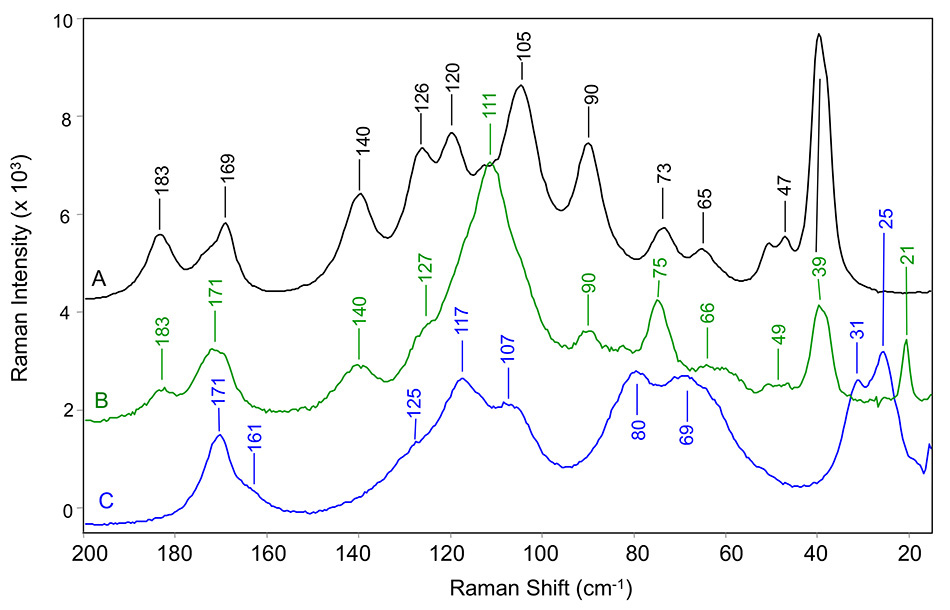
Figure 5: THz Raman spectra of carbamazepine in (A) form III, (B) pseudo-polymorphic dihydrate form, and (C) form II. All measured at room temperature [8].
In recent years, THz-Raman spectroscopy has transitioned out of research laboratories and into pharmaceutical process monitoring applications, often referred to as process analytical technology (PAT) [21-24]. In process applications, fiber-coupled THz-Raman probes enable in-line, on-line, and at-line measurement, where the analyzer can be remote from the sample and does not need the sample to be captured and brought to the analyzer. Depending on the demands, the probe tip can be designed with a short working distance for direct immersion into a reaction chamber through an access port, or with a longer working distance to collect spectra through a viewing window. Figure 6 shows an example of the TR-PROBE with an immersion probe tip attached.
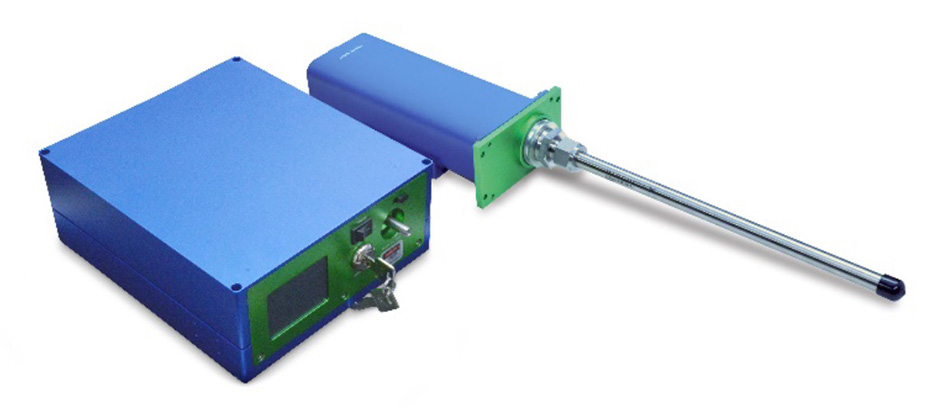
Figure 6: The TR-PROBE, THz-Raman probe module, with attached 11” long stainless-steel immersion tip from Coherent.
Inoue et al used this approach to monitor the transition of carbamazepine form III to carbamazepine dihydrate, for various concentrations of ethanol and water [22]. The results shown in figure 7, were calculated using a multivariate curve resolution (MCR) algorithm with the dominant THz-Raman bands of carbamazepine dihydrate (111 cm-1) and carbamazepine III (39 cm-1). Based on this data, the researchers were able to determine that the reaction produced the fastest conversion using a solution of 62.5% ethanol and 37.5% water.
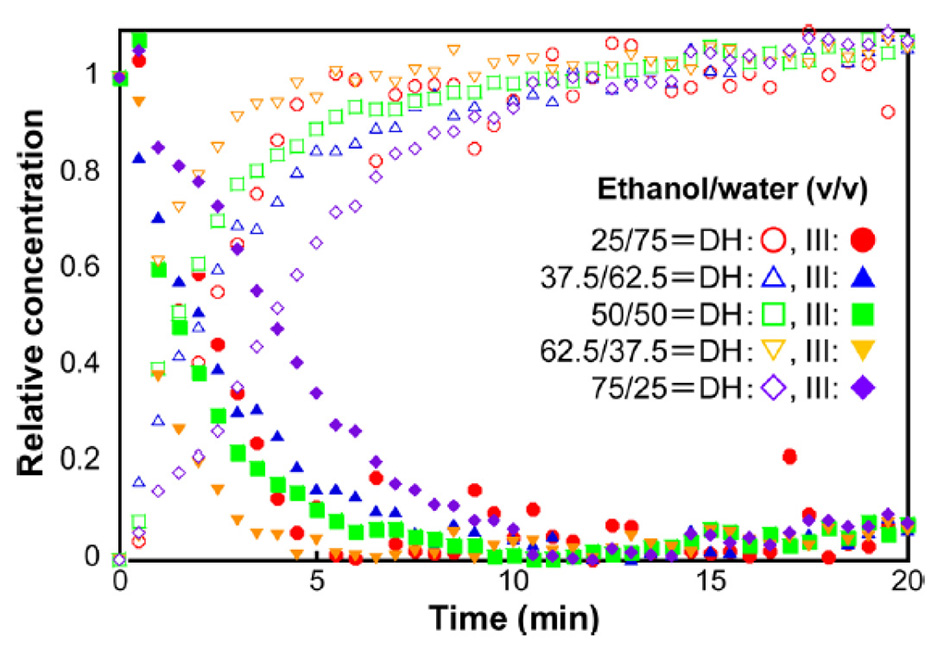
Figure 7: Concentration kinetics of carbamazepine form III conversion to carbamazepine dihydrate for various solvent ratios of ethanol and water [21].
The Future of THz-Raman
While the pharmaceutical industry was the first to widely adopt THz-Raman, other sectors are using it to analyze crystallinity and polymorphism as well. A recent example is the use of THz-Raman to explore the relationship between mobility and strain [25], as well as charge transport and low-frequency vibrations [12] in organic semiconductors. It is also being used to analyze phonon modes in quantum dots [11], and layered semiconductor alloys [13]. Recently studies have been also published on polymer crystallization [10] and the formation of lamella during the cooling process [26], providing critical information about structural properties of products for the polymer industry. Perhaps the most exciting up and coming applications of THz-Raman are in biology and biomedical diagnostics. At the 2019 SPIE BiOS conference in San Francisco, Marble et al. presented the first talk on using THz-Raman for biological molecules [14], and a year later, THz-Raman was already being explored as a potential diagnostics tool for COVID-19 [27].
Summary
THz-Raman has repeatedly been shown to provide users with robust and simultaneous structural and chemical compositional information. There is no doubt that the applications will continue to grow and expand as THz-Raman analyzers transition out of the lab and into industrial settings. It is inevitable at this point that researchers will continue to find new uses for the highly differentiating information revealed by THz-Raman that have not yet been conceived. For additional information on THz-Raman instrumentation, applications, or capabilities, please visit www.thz-raman.com or request a consultation with an applications scientist via our website www.coherent.com.
References:
[1] El Haddad, J., Bousquet, B., Canioni, L. and Mounaix, P., 2013. Review in terahertz spectral analysis. TrAC Trends in Analytical Chemistry, 44, pp.98-105.
[2] Dexheimer, S.L. ed., 2017. Terahertz spectroscopy: principles and applications. CRC press.
[3] Heyler, R.A., Carriere, J.T. and Havermeyer, F., 2013, May. THz-Raman: accessing molecular structure with Raman spectroscopy for enhanced chemical identification, analysis, and monitoring. In Next-Generation Spectroscopic Technologies VI (Vol. 8726, p. 87260J). International Society for Optics and Photonics.
[4] Gato, K., Fujii, M.Y., Hisada, H., Carriere, J., Koide, T. and Fukami, T., 2020. Molecular state evaluation of active pharmaceutical ingredients in adhesive patches for transdermal drug delivery. Journal of Drug Delivery Science and Technology, p.101800.
[5] Koide, T., Fukami, T., Hisada, H., Inoue, M., Carriere, J., Heyler, R., Katori, N., Okuda, H. and Goda, Y., 2016. Identification of pseudopolymorphism of magnesium stearate by using low-frequency Raman spectroscopy. Organic Process Research & Development, 20(11), pp.1906-1910.
[6] Tanabe, Y., Maeno, Y., Ohashi, K., Hisada, H., Roy, A., Carriere, J., Heyler, R. and Fukami, T., 2019. Screening a trace amount of pharmaceutical cocrystals by using an enhanced nano-spot method. European Journal of Pharmaceutics and Biopharmaceutics, 136, pp.131-137.
[7] Larkin, P.J., Wasylyk, J. and Raglione, M., 2015. Application of low-and mid-frequency Raman spectroscopy to characterize the amorphous-crystalline transformation of indomethacin. Applied Spectroscopy, 69(11), pp.1217-1228.
[8] Larkin, P.J., Dabros, M., Sarsfield, B., Chan, E., Carriere, J.T. and Smith, B.C., 2014. Polymorph characterization of active pharmaceutical ingredients (APIs) using low-frequency Raman spectroscopy. Applied Spectroscopy, 68(7), pp.758-776.
[9] Walker, G., Römann, P., Poller, B., Löbmann, K., Grohganz, H., Rooney, J.S., Huff, G.S., Smith, G.P., Rades, T., Gordon, K.C. and Strachan, C.J., 2017. Probing pharmaceutical mixtures during milling: The potency of low-frequency Raman spectroscopy in identifying disorder. Molecular Pharmaceutics, 14(12), pp.4675-4684.
[10] Marlina, D., Hoshina, H., Ozaki, Y. and Sato, H., 2019. Crystallization and crystalline dynamics of poly (3-hydroxybutyrate)/poly (4-vinylphenol) polymer blends studied by low-frequency vibrational spectroscopy. Polymer, 181, p.121790.
[11] Mork, A.J., Lee, E.M., Dahod, N.S., Willard, A.P. and Tisdale, W.A., 2016. Modulation of low-frequency acoustic vibrations in semiconductor nanocrystals through choice of surface ligand. The journal of physical chemistry letters, 7(20), pp.4213-4216.
[12] Sosorev, A.Y., Maslennikov, D.R., Kharlanov, O.G., Chernyshov, I.Y., Bruevich, V.V. and Paraschuk, D.Y., 2019. Impact of Low‐Frequency Vibrations on Charge Transport in High‐Mobility Organic Semiconductors. physica status solidi (RRL)–Rapid Research Letters, 13(3), p.1800485.
[13] Tharith, S., Hai, N.T.M., Lee, Y., Lim, S.Y., Van Quang, N., Kwanpyo, K., Sunglae, C. and Hyeonsik, C., 2020. Optical phonons of SnSe (1− x) S x layered semiconductor alloys. Scientific Reports (Nature Publisher Group), 10(1).
[14] Marble, K.S., Noojin, G.D., Coker, Z.N., Lalonde, J.W., Denton, M.L., Echchgadda, I., Yakovlev, V.V. and Cantu, J., 2019, March. Implementing low-frequency Raman spectroscopy to study biological molecules (Conference Presentation). In Optical Interactions with Tissue and Cells XXX (Vol. 10876, p. 108760H). International Society for Optics and Photonics.
[15] Steudel, R. and Eckert, B., 2003. Solid sulfur allotropes. In Elemental sulfur and sulfur-rich compounds I (pp. 1-80). Springer, Berlin, Heidelberg.
[16] Eckert, B. and Steudel, R., 2003. Molecular spectra of sulfur molecules and solid sulfur allotropes. In Elemental Sulfur und Sulfur-Rich Compounds II (pp. 31-98). Springer, Berlin, Heidelberg.
[17] Raw, A.S., Furness, M.S., Gill, D.S., Adams, R.C., Holcombe Jr, F.O. and Lawrence, X.Y., 2004. Regulatory considerations of pharmaceutical solid polymorphism in Abbreviated New Drug Applications (ANDAs). Advanced drug delivery reviews, 56(3), pp.397-414.
[18] Bras, L.P. and LOUREIRO, R., 2013. Polymorphic conversion monitoring using real-time Raman spectroscopy. Chimica Oggi-Chemistry Today, 31, p.5.
[19] Mazivila, S.J., Nogueira, H.I., Páscoa, R.N., Ribeiro, D.S., Santos, J.L., Leitão, J.M. and da Silva, J.C.E., 2020. Portable and benchtop Raman spectrometers coupled to cluster analysis to identify quinine sulfate polymorphs in solid dosage forms and antimalarial drug quantification in solution by AuNPs-SERS with MCR-ALS. Analytical Methods, 12(18), pp.2407-2421.
[20] Otaki, T., Tanabe, Y., Kojima, T., Miura, M., Ikeda, Y., Koide, T. and Fukami, T., 2018. In situ monitoring of cocrystals in formulation development using low-frequency Raman spectroscopy. International journal of pharmaceutics, 542(1-2), pp.56-65.
[21] Inoue, M., Hisada, H., Koide, T., Carriere, J., Heyler, R. and Fukami, T., 2017. In situ monitoring of crystalline transformation of carbamazepine using probe-type low-frequency Raman spectroscopy. Organic Process Research & Development, 21(2), pp.262-265.
[22] Nomura, K., Titapiwatanakun, V., Hisada, H., Koide, T. and Fukami, T., 2020. In situ monitoring of the crystalline state of active pharmaceutical ingredients during high-shear wet granulation using a low-frequency Raman probe. European Journal of Pharmaceutics and Biopharmaceutics, 147, pp.1-9.
[23] Walker, G., Römann, P., Poller, B., Löbmann, K., Grohganz, H., Rooney, J.S., Huff, G.S., Smith, G.P., Rades, T., Gordon, K.C. and Strachan, C.J., 2017. Probing pharmaceutical mixtures during milling: The potency of low-frequency Raman spectroscopy in identifying disorder. Molecular Pharmaceutics, 14(12), pp.4675-4684.
[24] Choi, H.H., Yi, H.T., Tsurumi, J., Kim, J.J., Briseno, A.L., Watanabe, S., Takeya, J., Cho, K. and Podzorov, V., 2020. A Large Anisotropic Enhancement of the Charge Carrier Mobility of Flexible Organic Transistors with Strain: A Hall Effect and Raman Study. Advanced Science, 7(1), p.1901824.
[25] Samuel, A.Z. and Hamaguchi, H.O., 2018. A General Approach for Estimating Lamella‐Thickness Distribution in Polymers with Low‐Frequency Raman Spectroscopy: Application to Lamella Formation in Crystallizing Polyethylene. Chemistry–A European Journal, 24(37), pp.9333-9339.
[26] Damle, V.H., Rajeswaran, B. and Tischler, Y.R., 2020. Low-Frequency Raman Spectroscopy as a Diagnostic Tool for COVID-19 and other Coronaviruses. Royal Society Open Science (In Review).